Ranked by ipSAE (real values from Boltz-2 ipSAE ranking) across all campaigns. Higher ipSAE = better predicted interface contacts.
| Rank | Name | Campaign | Length | ipTM | ipSAE | pLDDT | pTM |
|---|
Top 10 Designs Overview
ipTM vs ipSAE
| Rank | Design | Campaign | Length | Boltz ipTM | ipSAE | Boltz pLDDT | Boltz pTM | AF3 ipTM | AF3 pTM | OF3 ipTM | OF3 pTM | Pb ipSAE | Pb ipTM | Pipeline | Download |
|---|
| Campaign | Pipeline | Hotspots | Size |
|---|---|---|---|
| RFdiff E2 small | RFdiff+MPNN | A44,A45,A46,A51,A54,A56,A57,A79,A83,A84,A87,A95,A96 | 40-65 AA |
| RFdiff E2 med | RFdiff+MPNN | A44,A45,A46,A51,A54,A56,A57,A79,A83,A84,A87,A95,A96 | 90-120 AA |
| RFdiff E2 enhanced | RFdiff+MPNN | Above + A42,A53 (ESM-2 DMS additions) | 40-65 AA |
| RFdiff Beta E2 | RFdiff+MPNN | A44,A45,A46,A51,A56,A57,A79,A83,A87,A95,A96 | 40-65 AA |
| RFdiff Cullin small | RFdiff+MPNN | A27,A29,A30,A31,A33,A35,A36,A73,A75,A101 | 40-65 AA |
| RFdiff Cullin med | RFdiff+MPNN | A27,A29,A30,A31,A33,A35,A36,A73,A75,A101 | 90-120 AA |
| RFdiff Beta Cullin | RFdiff+MPNN | A27,A29,A30,A31,A33,A35,A36,A73,A75,A101 | 40-65 AA |
| BoltzGen small | BoltzGen | None (untargeted) | 40-65 AA |
| BoltzGen medium | BoltzGen | None (untargeted) | 90-120 AA |
| Campaign | Scored | iPSAE mean | iPSAE max | >0.7 | >0.5 | Best len |
|---|---|---|---|---|---|---|
| RFdiff E2 small | 11,792 | 0.226 | 0.877 | 355 | 1,790 | 51 |
| RFdiff E2 med | 196 | 0.252 | 0.801 | 8 | 31 | 98 |
| RFdiff Beta E2 | 104 | 0.313 | 0.821 | 11 | 24 | 55 |
| RFdiff Cullin small | 128 | 0.240 | 0.805 | 8 | 24 | 60 |
| RFdiff Cullin med | 128 | 0.278 | 0.793 | 7 | 25 | 111 |
| BoltzGen (untargeted) | 1,840 | 0.378 | 0.773 | 3 | 418 | 62 |
| Other/pilot | 40 | 0.174 | 0.685 | 0 | 2 | 50 |
Core: A44(I), A45(C), A46(R), A51(D), A56(C), A57(Q)
Extended: A54(I*), A79(F), A83(C), A84(I*), A87(W), A95(P), A96(L)
* I54, I84 added from ESM-2 DMS (mutation-sensitive, missed by conservation)
Core: A27(W), A29(A), A30(V), A31(A), A33(W), A35(W)
Extended: A36(D), A73(G), A75(C), A101(W)
Quality-filtered ranking: (1) AF3 ipTM >= 0.5 (18 designs), then (2) OF3 ipTM >= 0.5 (82 designs). Only designs that pass orthogonal validation thresholds are included. No junk.
FASTA headers include all metrics for quick reference.
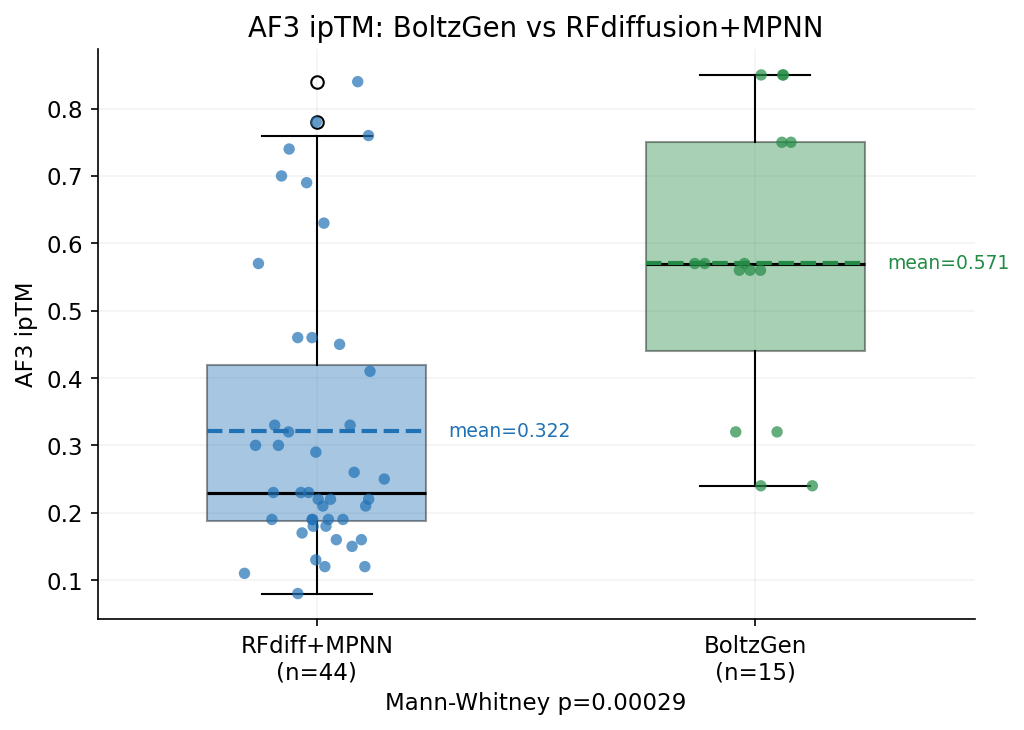
The primary competition metric (ipSAE) and Boltz-2 ipTM show no correlation with AF3 ground-truth validation. AF3 does correlate with OF3, suggesting both capture real structural features that Boltz-2 misses.
Three independent structure prediction methods -- Boltz-2 (scoring), OpenFold3, and AlphaFold3 -- show dramatically different agreement patterns. AF3 is the ground-truth orthogonal validation.
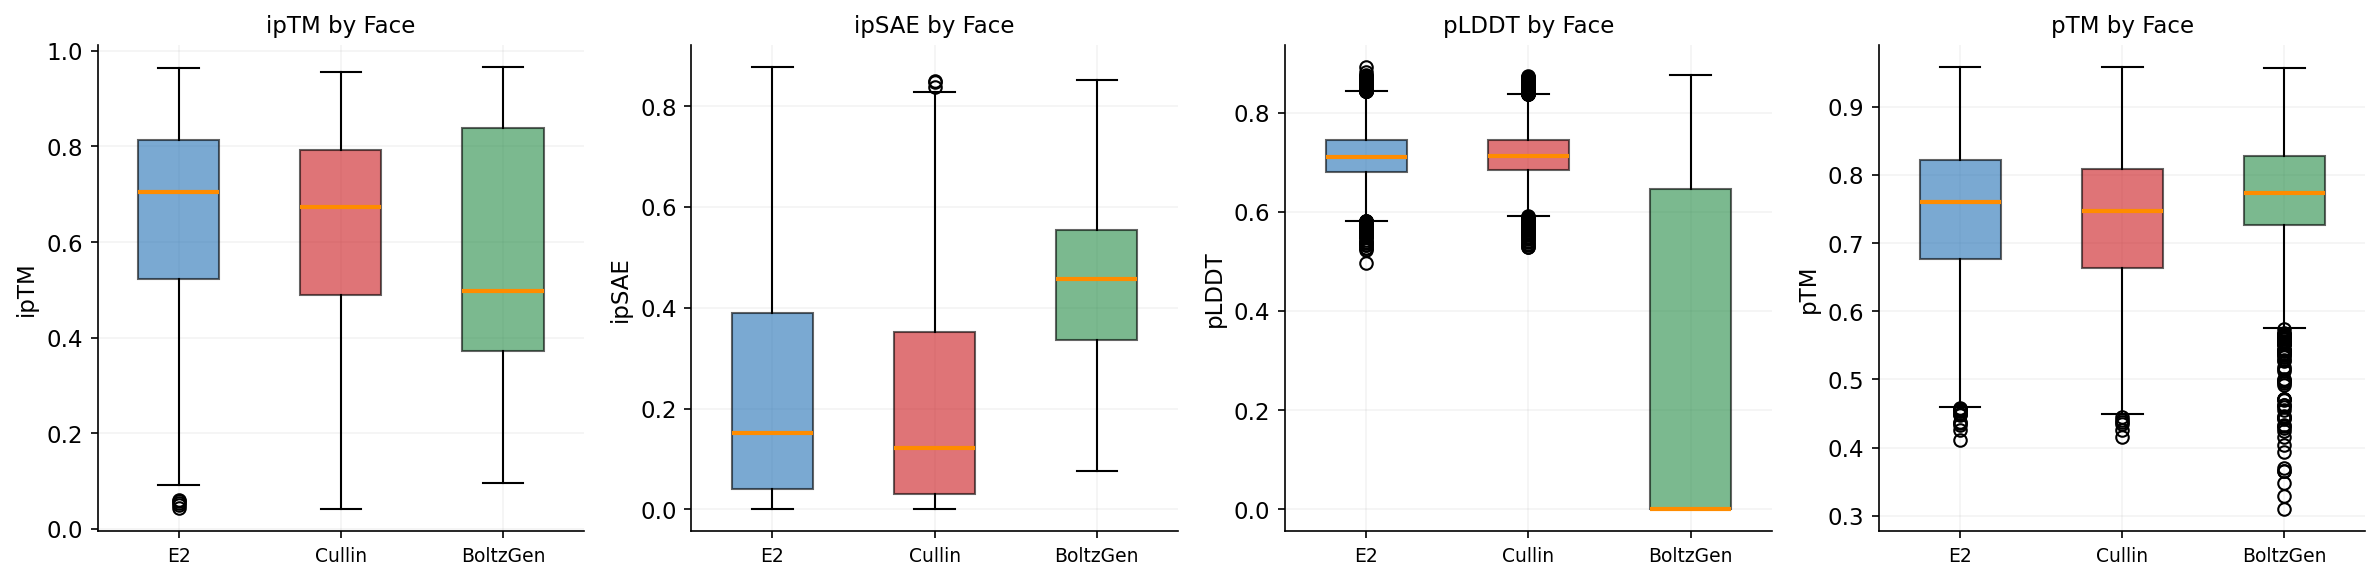
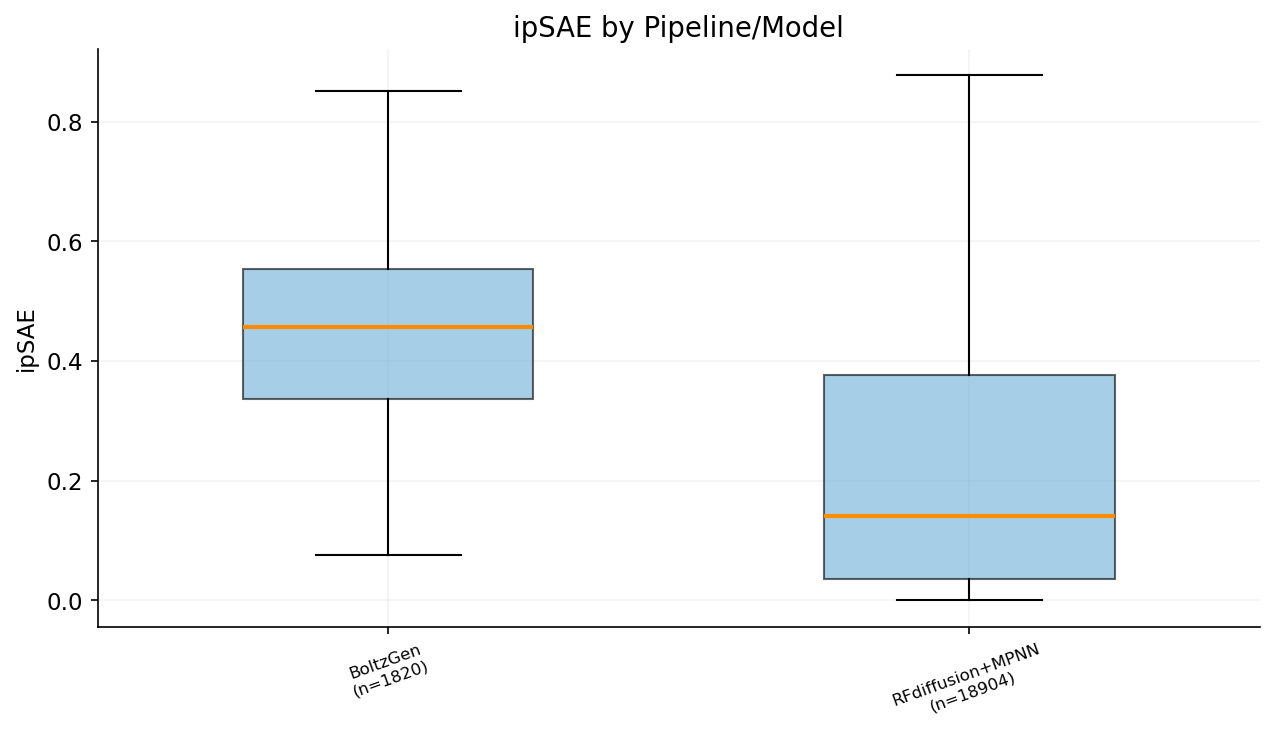
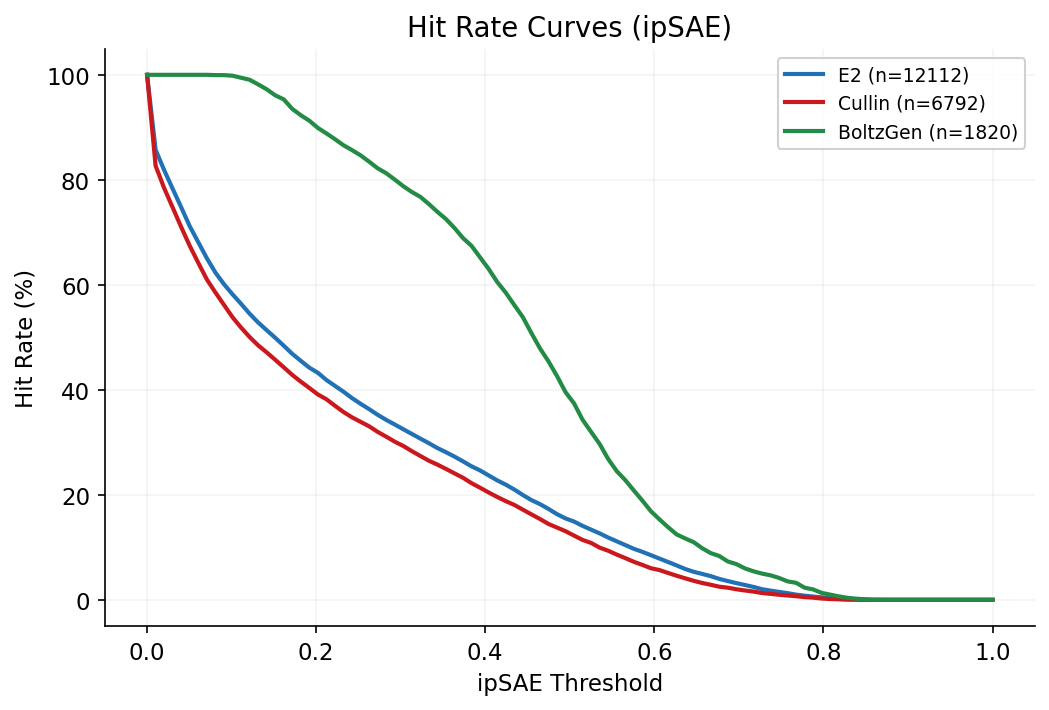
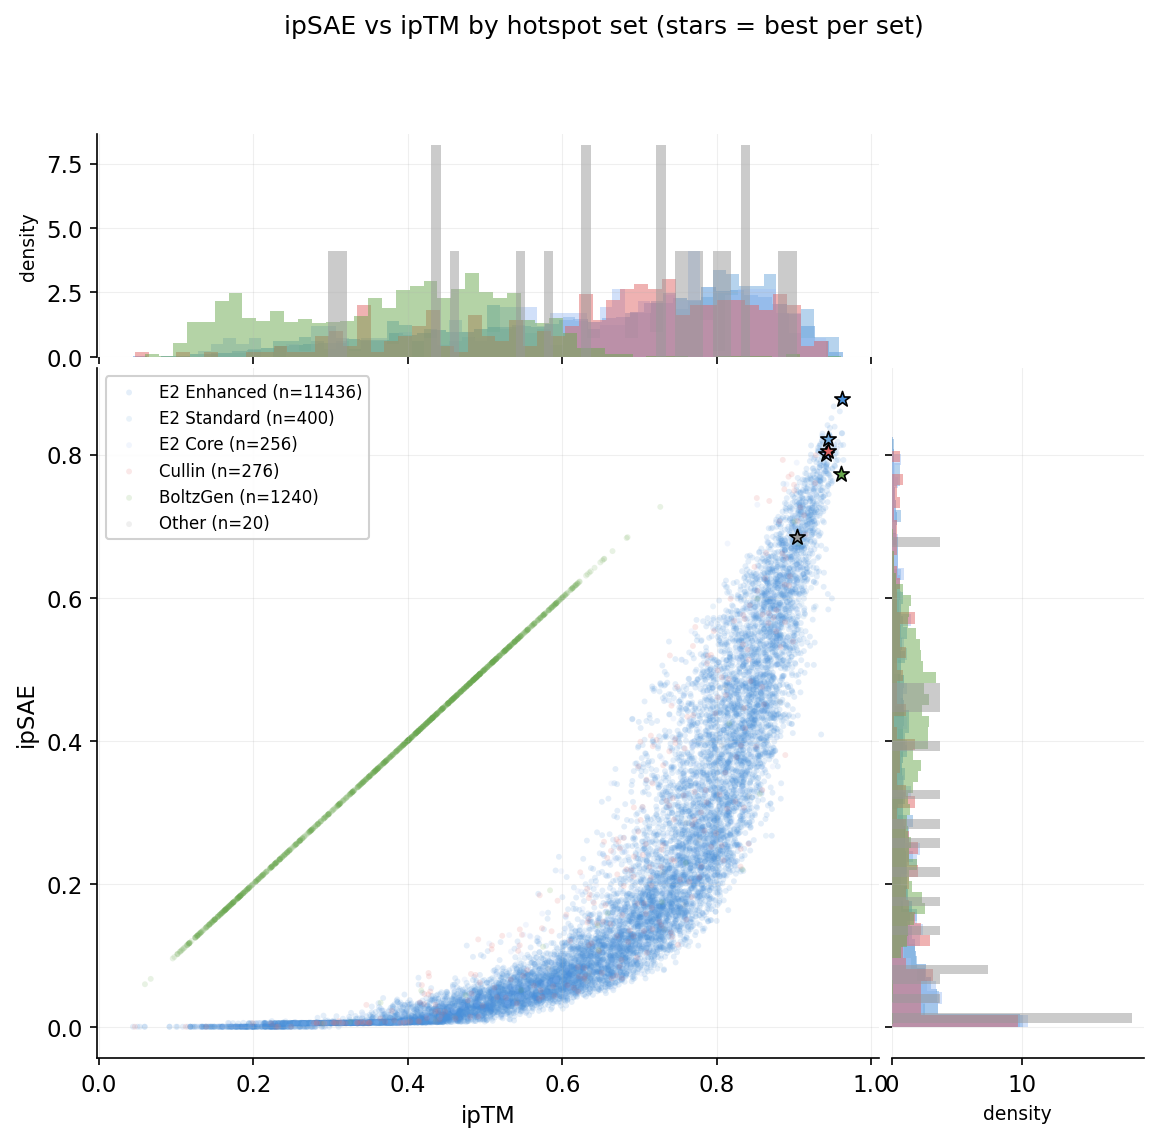
Designs target three RBX1 surfaces: E2 interface (12,112 designs), Cullin interface (6,791), and BoltzGen full-surface (1,820). ipSAE and structural confidence metrics vary by target.
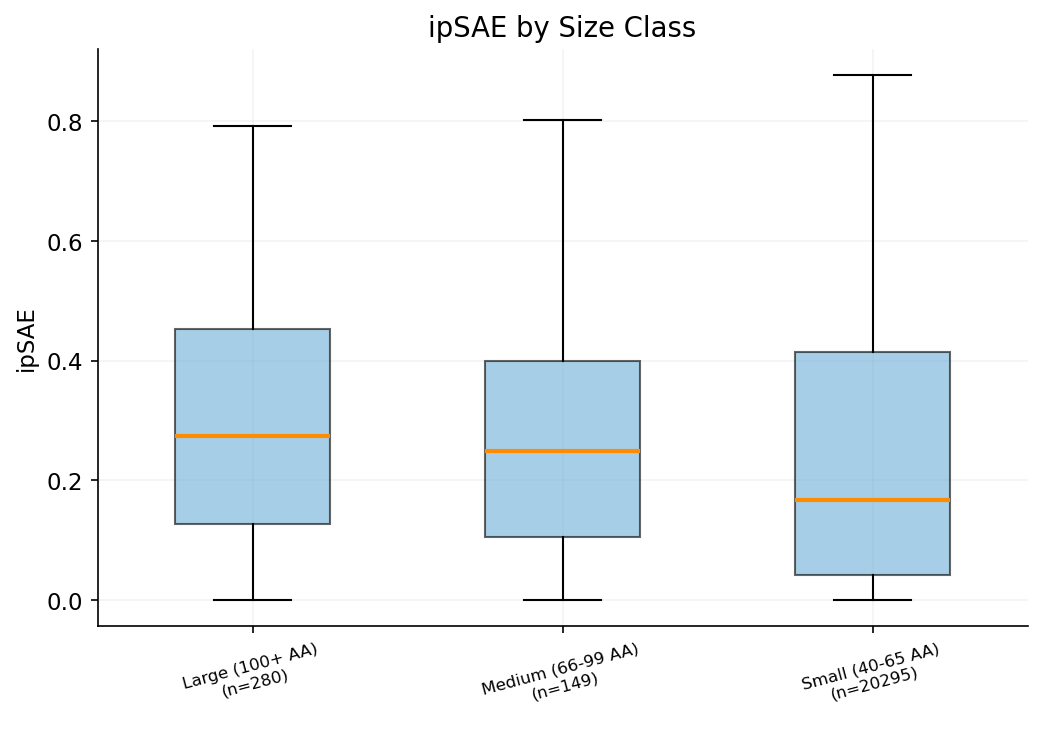
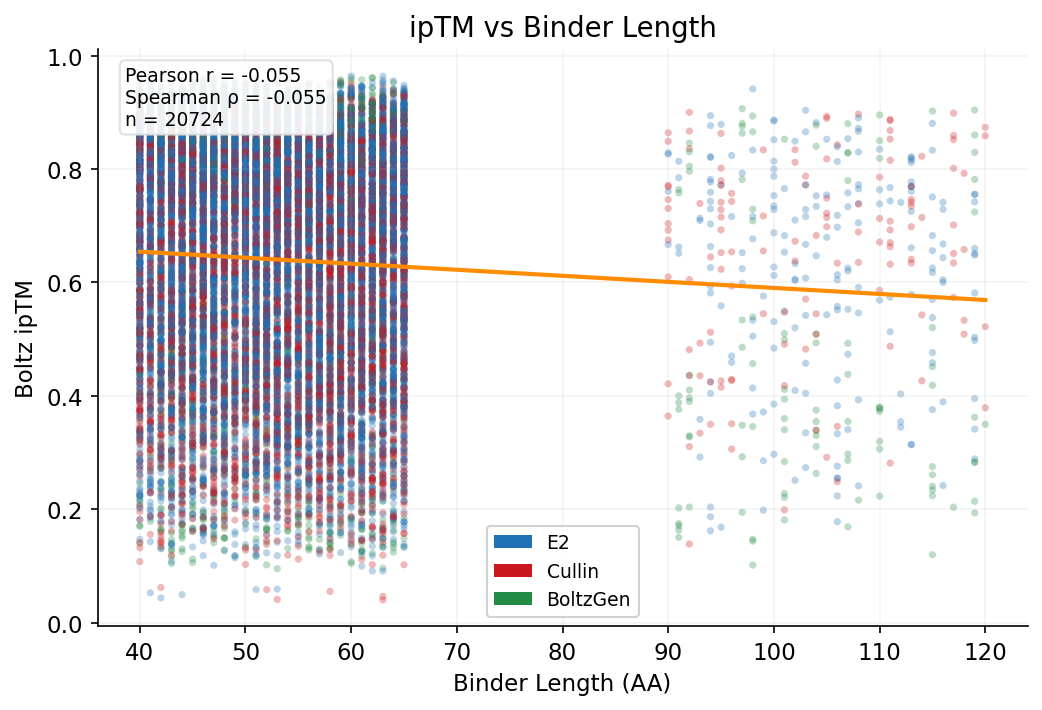
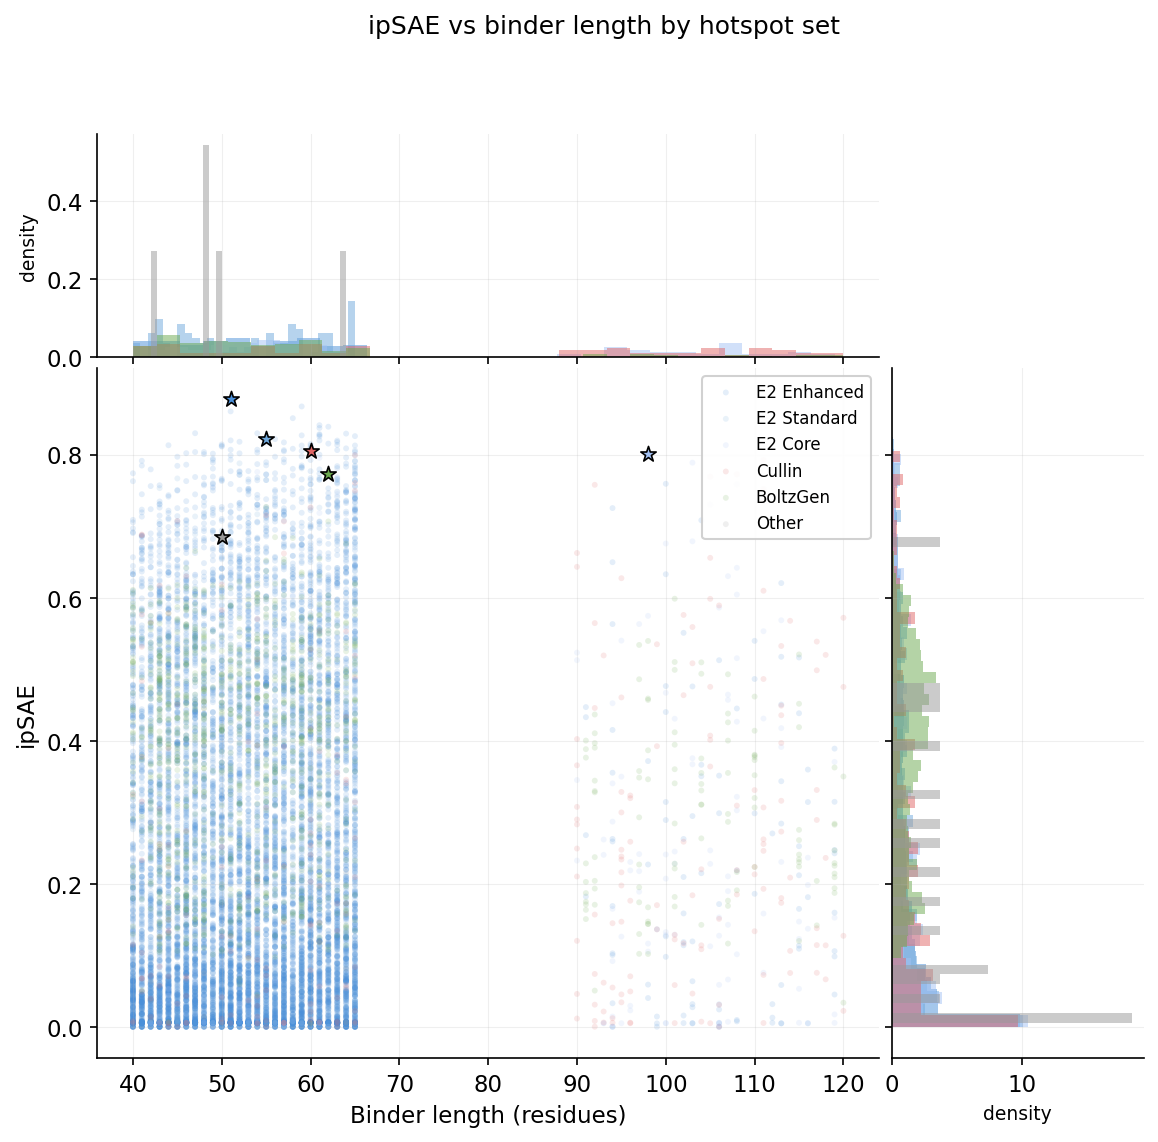
Binder lengths range from under 55 to over 100 amino acids. Size buckets reveal whether longer binders achieve better interface quality or structural confidence.
Designs were generated with three model variants: Base (standard Boltz-2), Beta (beta checkpoint), and BoltzGen (generative model). Comparing ipSAE across checkpoints.
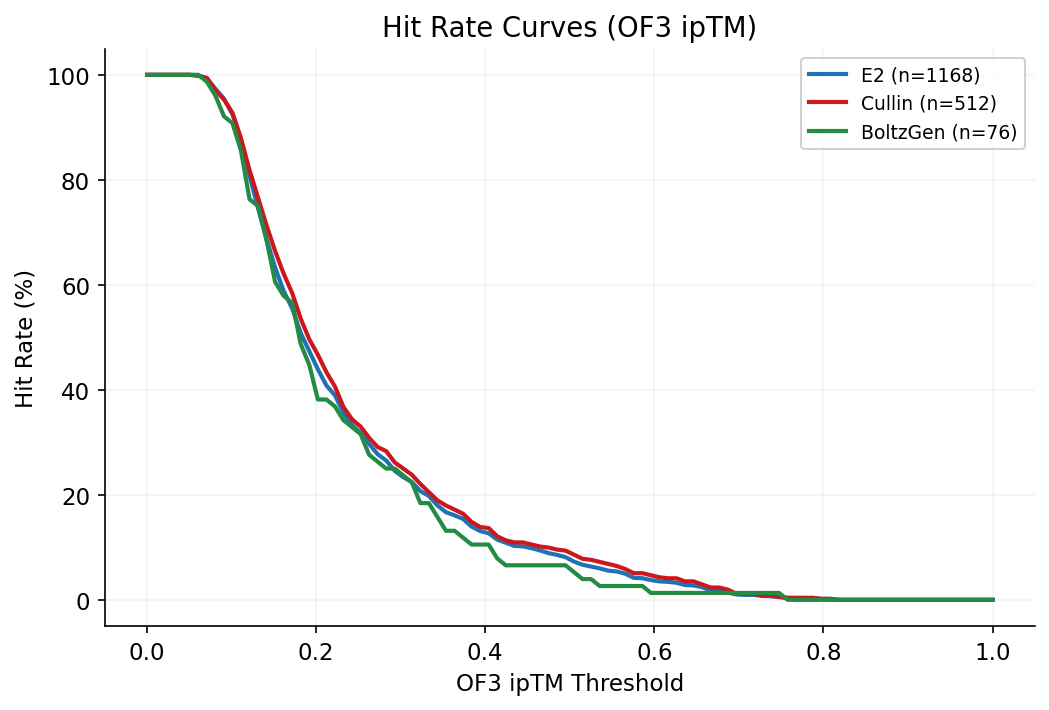
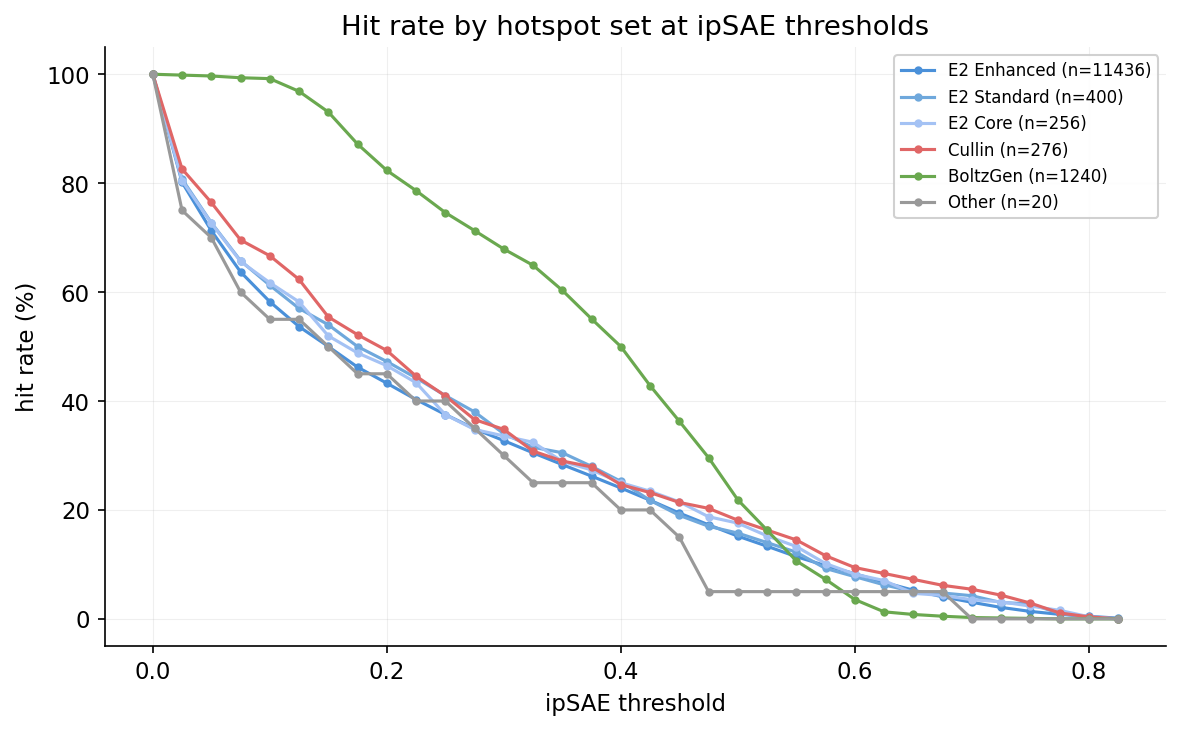
Hit rate curves show the fraction of designs exceeding a given quality threshold across the full ipSAE and OF3 ipTM ranges, stratified by target face.
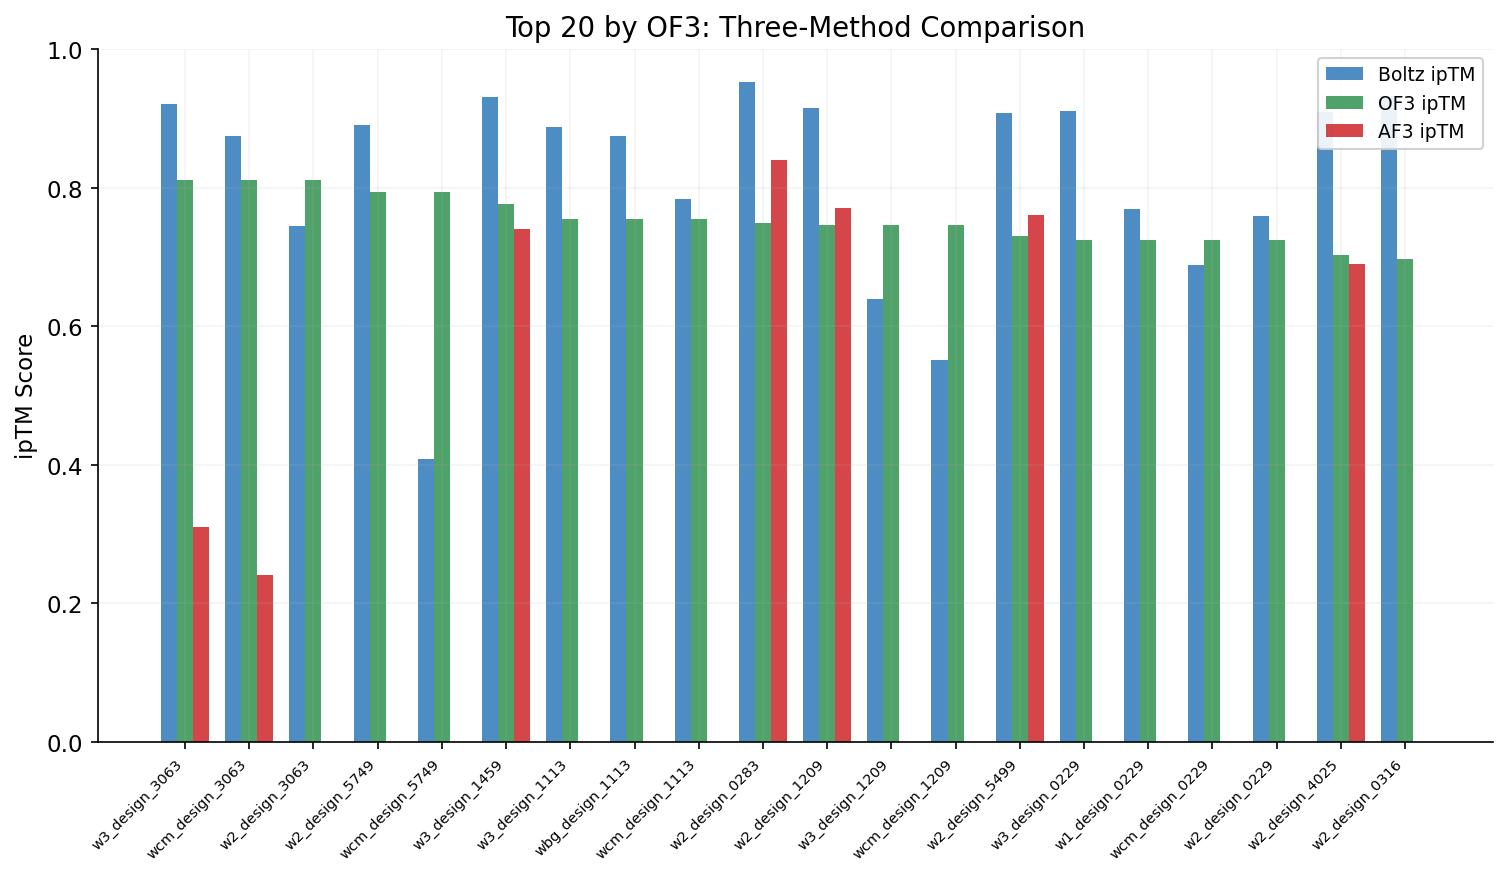
Side-by-side comparison of Boltz-2, OpenFold3, and AlphaFold3 ipTM scores for top designs ranked by OF3 validation. Highlights consistent Boltz-2 score inflation across methods.
Each RFdiffusion campaign was conditioned on a specific set of RBX1 hotspot residues. Four distinct hotspot sets were used:
E2 Standard: A44, A45, A46, A51, A56, A57, A79, A83, A87, A95, A96 (400 designs)
E2 Core: A44, A45, A46, A51, A54, A56, A57, A79, A83, A84, A87, A95, A96 (256 designs)
Cullin: A27, A29, A30, A31, A33, A35, A36, A73, A75, A101 (276 designs)
BoltzGen: No hotspot conditioning (1,240 designs)
ipSAE vs ipTM by hotspot set
ipSAE vs binder length by hotspot set
Hit rate by hotspot set
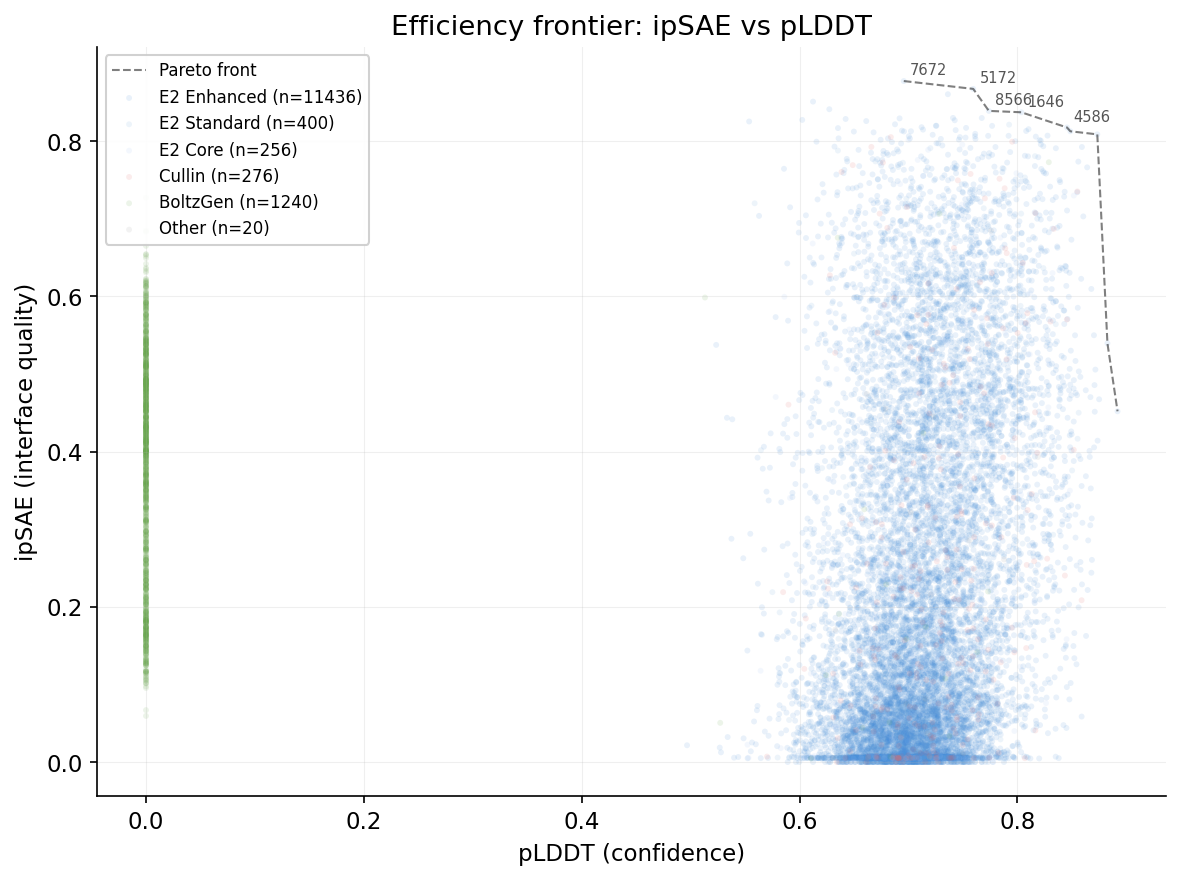
Efficiency frontier: ipSAE vs pLDDT
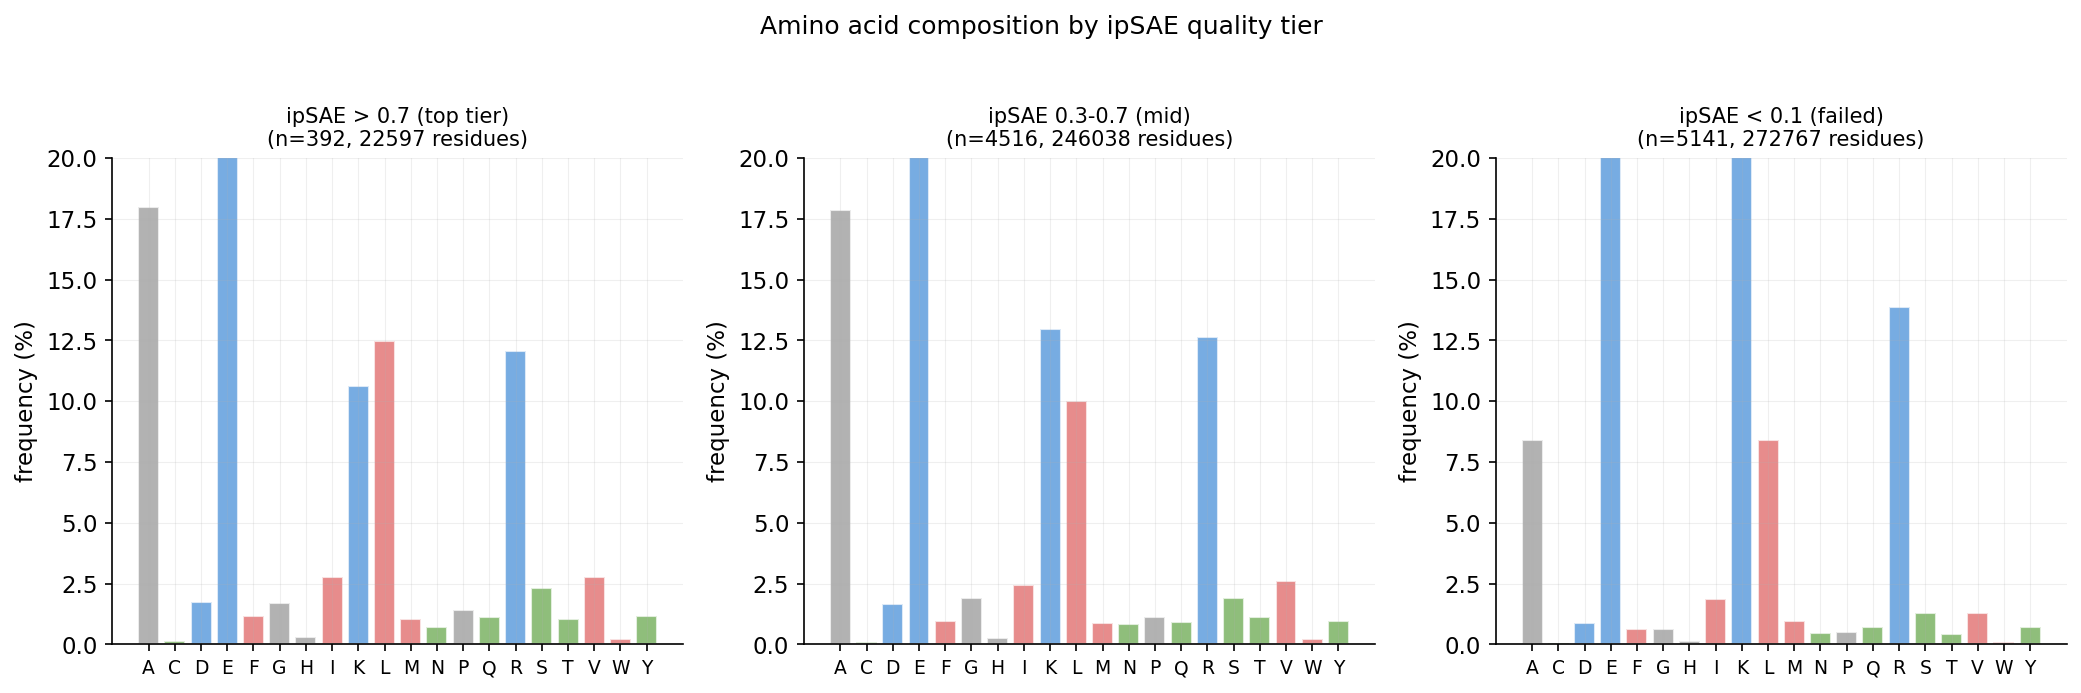
Amino acid composition by ipSAE quality tier
Conservation analysis from 165-sequence MSA (MAFFT) of RBX1 homologs across eukaryotes. 834 raw homologs collected via HMMER, filtered to 272 non-redundant sequences, aligned with 1155 total rows including outgroups.
Shannon entropy-based conservation score (0 = variable, 1 = perfectly conserved). Colored by functional role: E2 interface, Cullin interface, Zinc-binding, other. Hover for details.
Histogram of Shannon entropy values across all 108 residues. Lower entropy = higher conservation.
Mean conservation by functional region.
Mean alignment gap fraction. Lower = better coverage in the MSA.
| Residue # | Amino Acid | Conservation | Entropy | Gap Fraction | Functional Role |
|---|
Avg Conservation: 0.943
Role: Stabilizes RING-H2 domain fold, part of E2 recruitment surface
Avg Conservation: 0.956
Role: Structural zinc, anchors the beta-sheet core between the two interfaces
Avg Conservation: 0.922
Role: Bridges the E2-binding loop to the core, critical for domain integrity
Residues: 41,42,43,44,45,46,47,48,51,52,53,54,55,56,57,58,59,79,81,82,83,84,85,86,87,88,90,91,93,94,95,96,97,98,99
Mean conservation: 0.839
Hotspots (RFdiffusion): B44-B48, B52, B55-B57, B84-B88, B95-B98
Key residues: R46 (1.0), C94 (0.988), I44 (0.948), C56 (0.966), P95 (0.947)
Residues: 23,24,25,26,27,28,29,30,31,32,33,34,35,36,37,72,73,74,75,76,89,90,91,92,93,99,100,101,102,103,104
Mean conservation: 0.938
Hotspots (RFdiffusion): B24-B34, B72-B75, B100-B104
Key residues: W33 (1.0), W35 (1.0), G73 (1.0), W101 (0.988), V30 (0.974)
RBX1 is deeply conserved across eukaryotes. The RING-H2 domain (residues ~27–104) shows uniformly high conservation (>0.7 for nearly all positions), with zinc-coordinating cysteines and histidines reaching near-perfect conservation (0.91–1.0). The N-terminal tail (residues 1–20) is more variable, consistent with it being unstructured in the NMR ensemble (2LGV).
The Cullin face is significantly more conserved than the E2 face (mean 0.938 vs 0.839). This makes sense: the Cullin interaction is constitutive (RBX1 is always bound to a Cullin scaffold in vivo), whereas the E2 interface cycles through multiple E2 partners. The higher conservation at the Cullin face means binders targeting it are more likely to disrupt a functionally critical interaction, but the surface may also be harder to compete with due to the tight, conserved binding.
Three perfectly conserved residues stand out: W33, W35 (both Cullin face), G73 (Cullin face), and R46 (E2 face). These are absolutely invariant across all 165 sequences in the MSA. W33 and W35 form a tryptophan pair that likely stacks against the Cullin surface—a classic hot-spot motif. R46 is the catalytic arginine critical for E2 activation.
Gap fraction is low (<2%) for the core domain (residues 36–105), meaning the MSA is well-aligned in the structured region. The N/C-terminal tails show higher gaps (10–27%), reflecting length variation among homologs. This gives confidence that the conservation scores in the core are reliable.
Design implications: The 60/40 E2/Cullin split is well-justified. The Cullin face offers a tighter, more conserved target with multiple tryptophan hot-spots, favoring high-affinity designs. The E2 face is more diverse, potentially offering more epitope options but requiring designs that can outcompete the native E2 partners. The zinc sites should be included in the target structure but not directly targeted—they are buried and structurally critical, not surface-accessible.
Each residue colored by conservation score. Hover for details.
Masked marginal log-likelihood ratios (dLLR) computed with ESM-2 (650M params) for all single-point mutations across the 108-residue RBX1 sequence. More negative dLLR = more deleterious mutation. Sensitivity = mean |dLLR| across all 20 amino acids at each position.
Log-likelihood ratio for each of 20 amino acids at each position. Blue = tolerated/beneficial, red = deleterious. Wild-type residue marked with black dot. Hover for values.
Mean |dLLR| across all 20 amino acids. Higher = less tolerant of mutations. Colored by functional role.
Spearman r = 0.581, Pearson r = 0.714. Strong agreement between model-predicted and evolutionary constraint.
ESM-2 attention-derived contact predictions (probability > 0.5). 31 high-confidence contacts.
| Rank | Position | WT → Mut | dLLR | Functional Role | WT Conservation |
|---|
| Residue | AA | ESM Sensitivity | Evo Conservation | WT Log-Prob | Functional Role |
|---|
ESM-2 and evolution strongly agree on which residues are critical. The Spearman correlation of 0.581 (p < 10-10) and Pearson of 0.714 (p < 10-17) between ESM-2 sensitivity and Shannon entropy conservation confirm that the protein language model has learned genuine structural and functional constraints from sequence alone.
Zinc-coordinating cysteines dominate the sensitivity landscape. C42, C56, C83, C75, C53, C68, and C94 are all among the top 15 most sensitive positions. Any mutation at these sites is catastrophic (dLLR < -10), consistent with their role as structural zinc ligands that maintain the RING-H2 fold. The most deleterious single mutation in the entire protein is I54W (dLLR = -18.25), a massive tryptophan insertion into the hydrophobic core adjacent to C53 and C56.
The Cullin face has the single most sensitive residue (D36, sensitivity = 13.0), which also has perfect evolutionary conservation (0.945). This aspartate likely forms critical salt bridges in the Cullin interaction. For binder design, targeting residues around D36 could be highly effective at disrupting the complex.
ESM-2 identifies some positions as sensitive that conservation misses. I54 (ESM sensitivity rank 5, conservation only 0.786) and I84 (rank 11, conservation 0.802) are moderately conserved but ESM predicts they are among the most intolerant of mutations — likely because they play critical roles in hydrophobic packing that the MSA alone doesn't fully capture.
Design implications: Binders should maximize contacts with high-sensitivity residues (especially D36, C42, R46, F79, W87) since these positions cannot easily mutate to escape binding. The DMS data also suggests that the N-terminal tail (residues 1–20) has low mutation sensitivity, confirming it is a poor target for binder design.
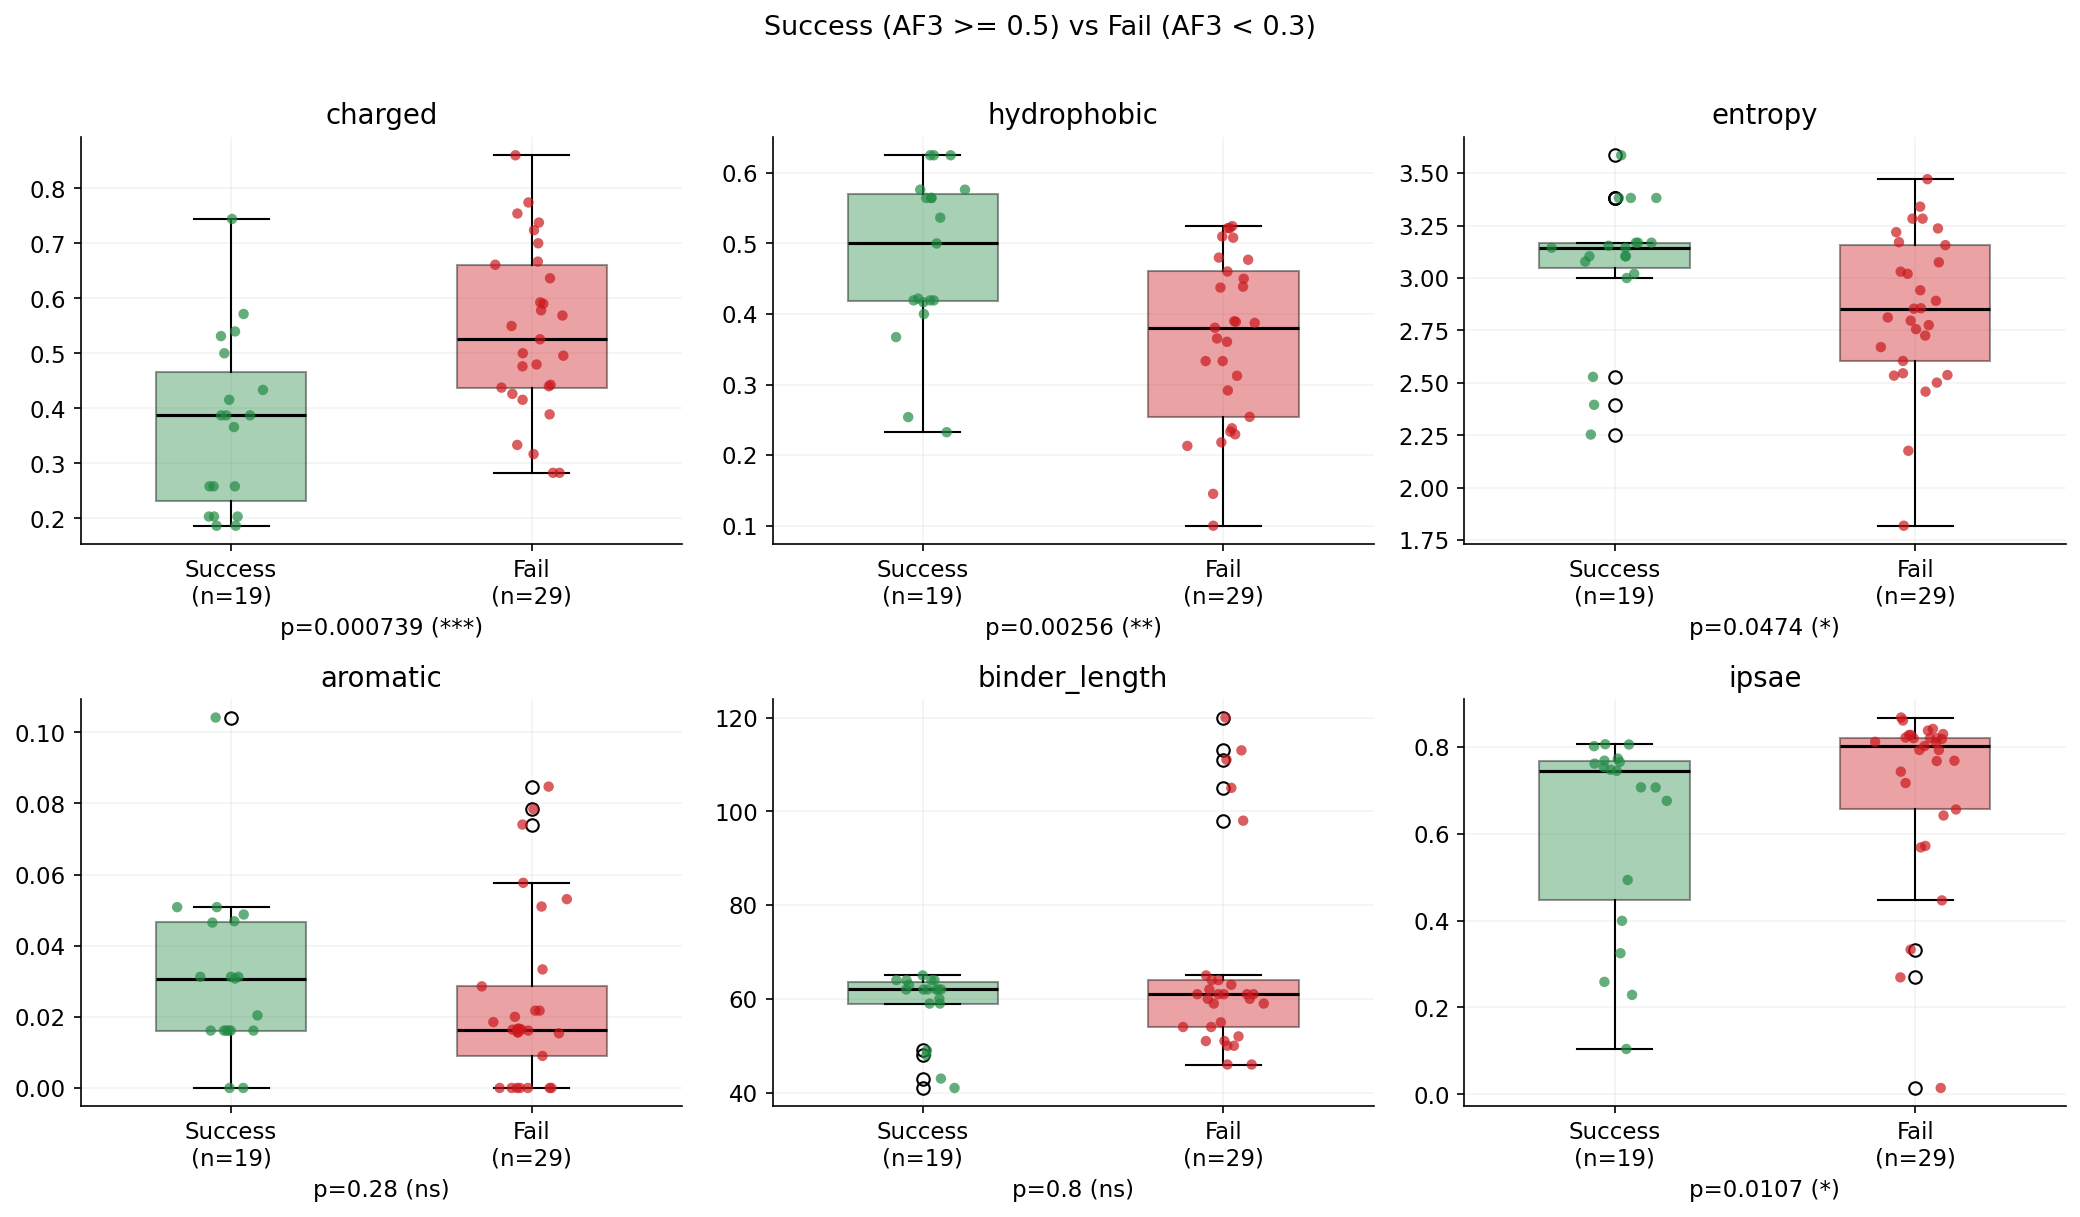
Comprehensive analysis of what predicts AlphaFold3 validation success. 60 designs validated with AF3, analyzed using Lasso regression on sequence and structural features. AF3 is our ground-truth orthogonal validation — Boltz-2 scores are heavily inflated for E2-face RFdiffusion designs.
LassoCV regression on 20 sequence and design features to predict AF3 ipTM. Features with non-zero coefficients are the strongest predictors after regularization. Positive = helps AF3 validation, negative = hurts.
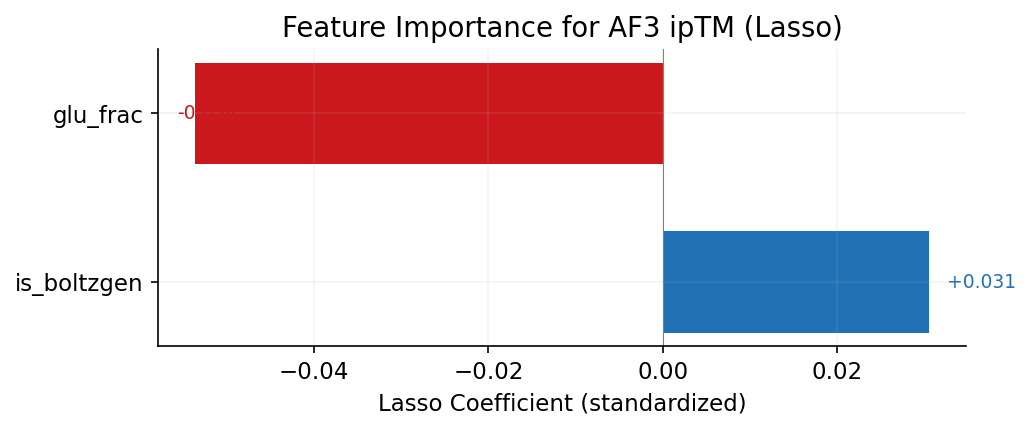
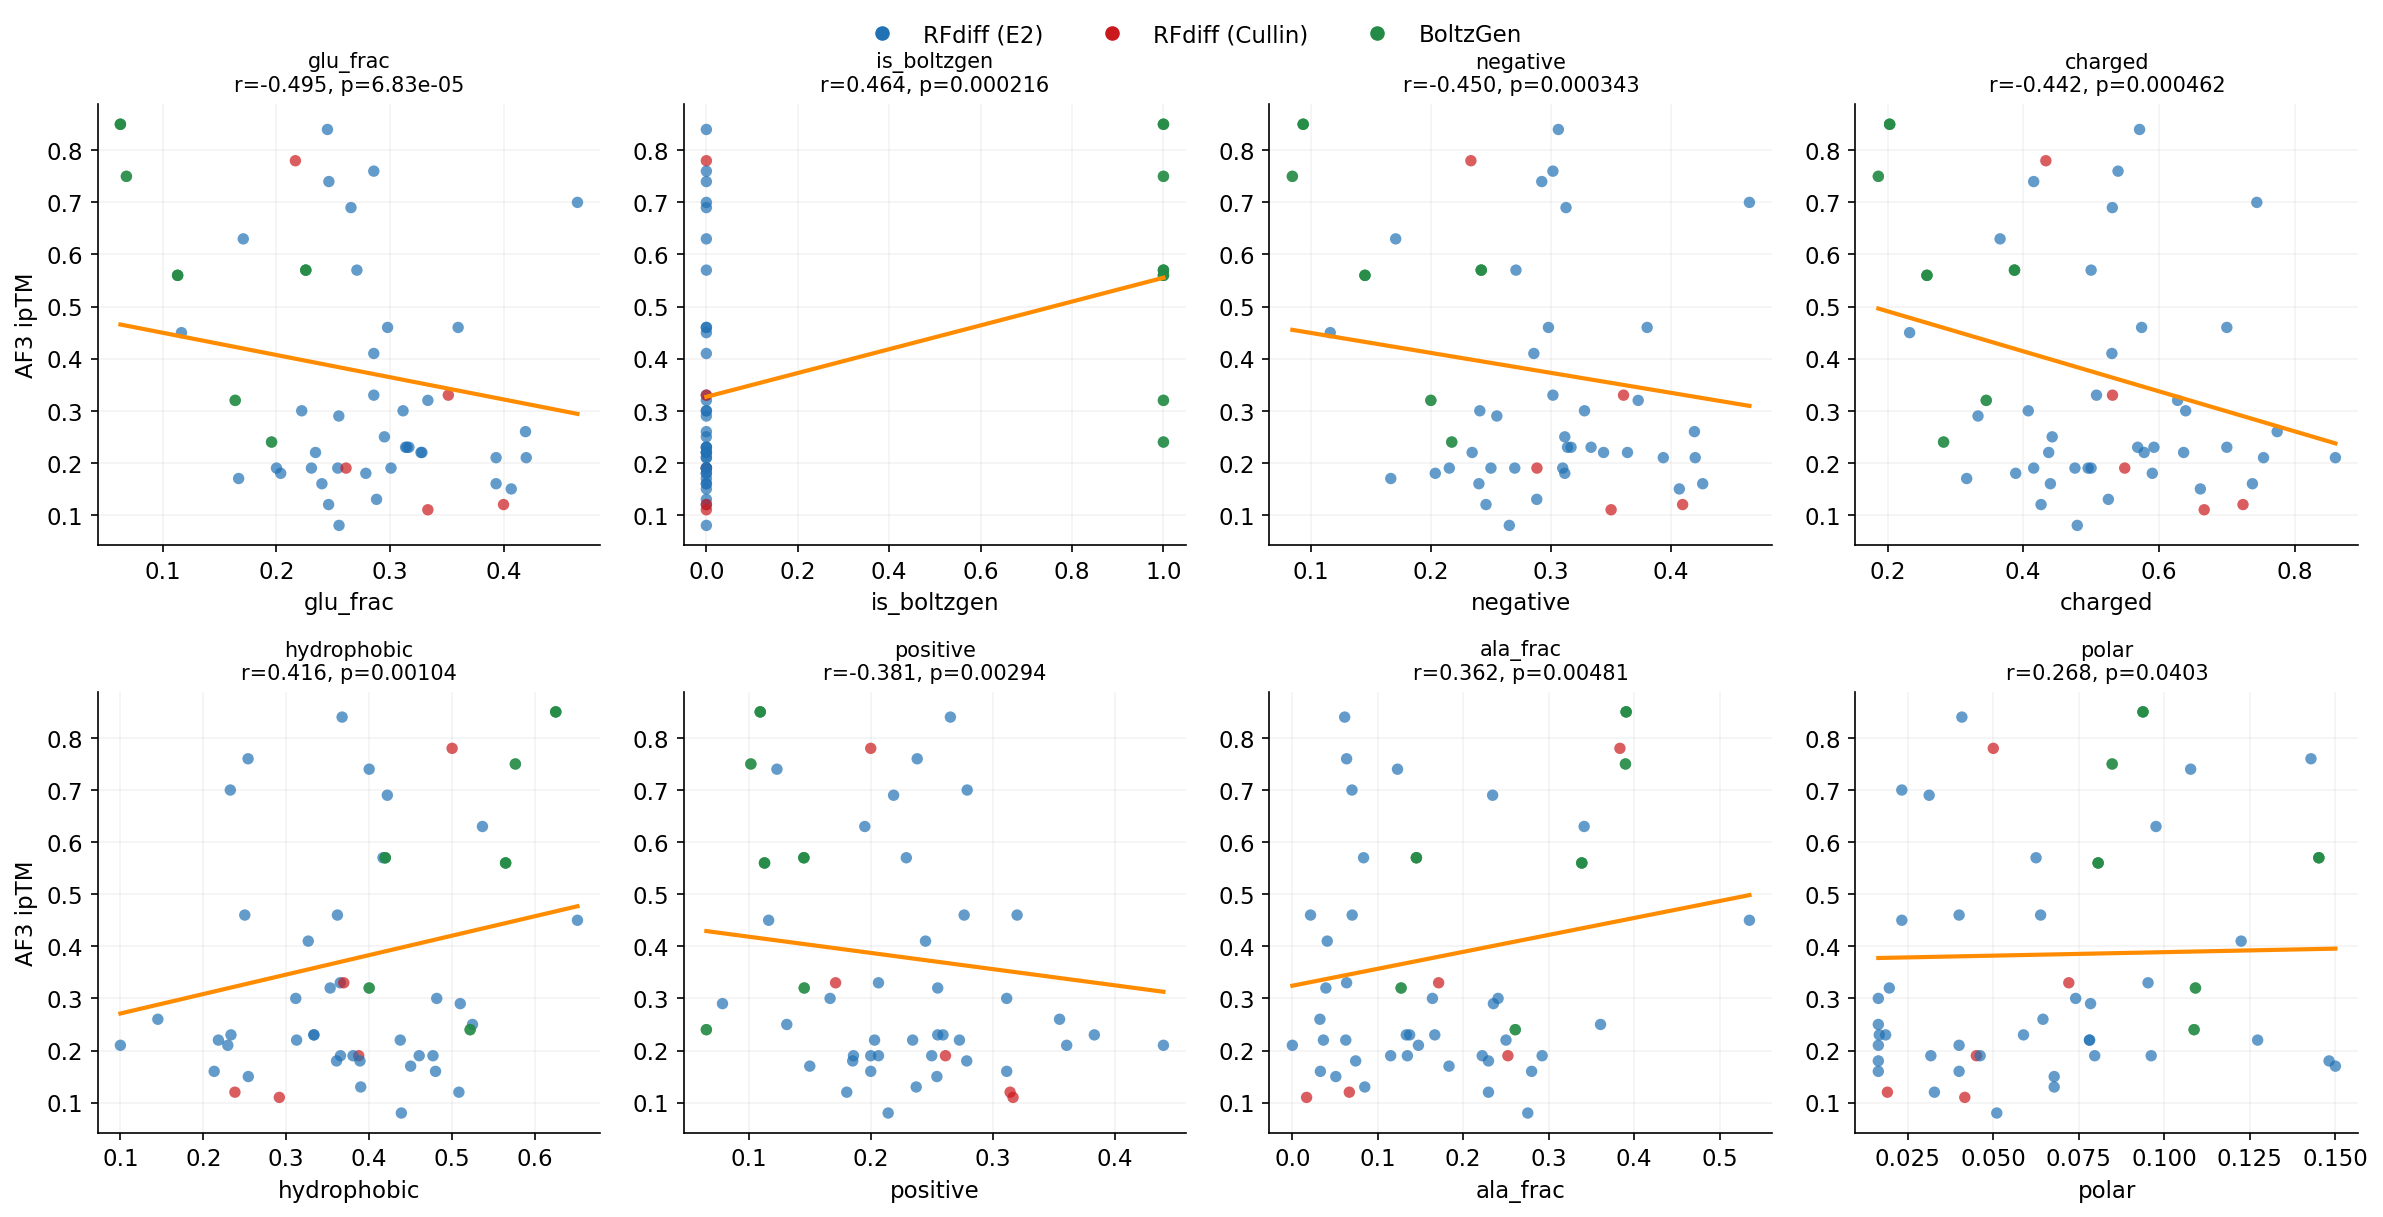
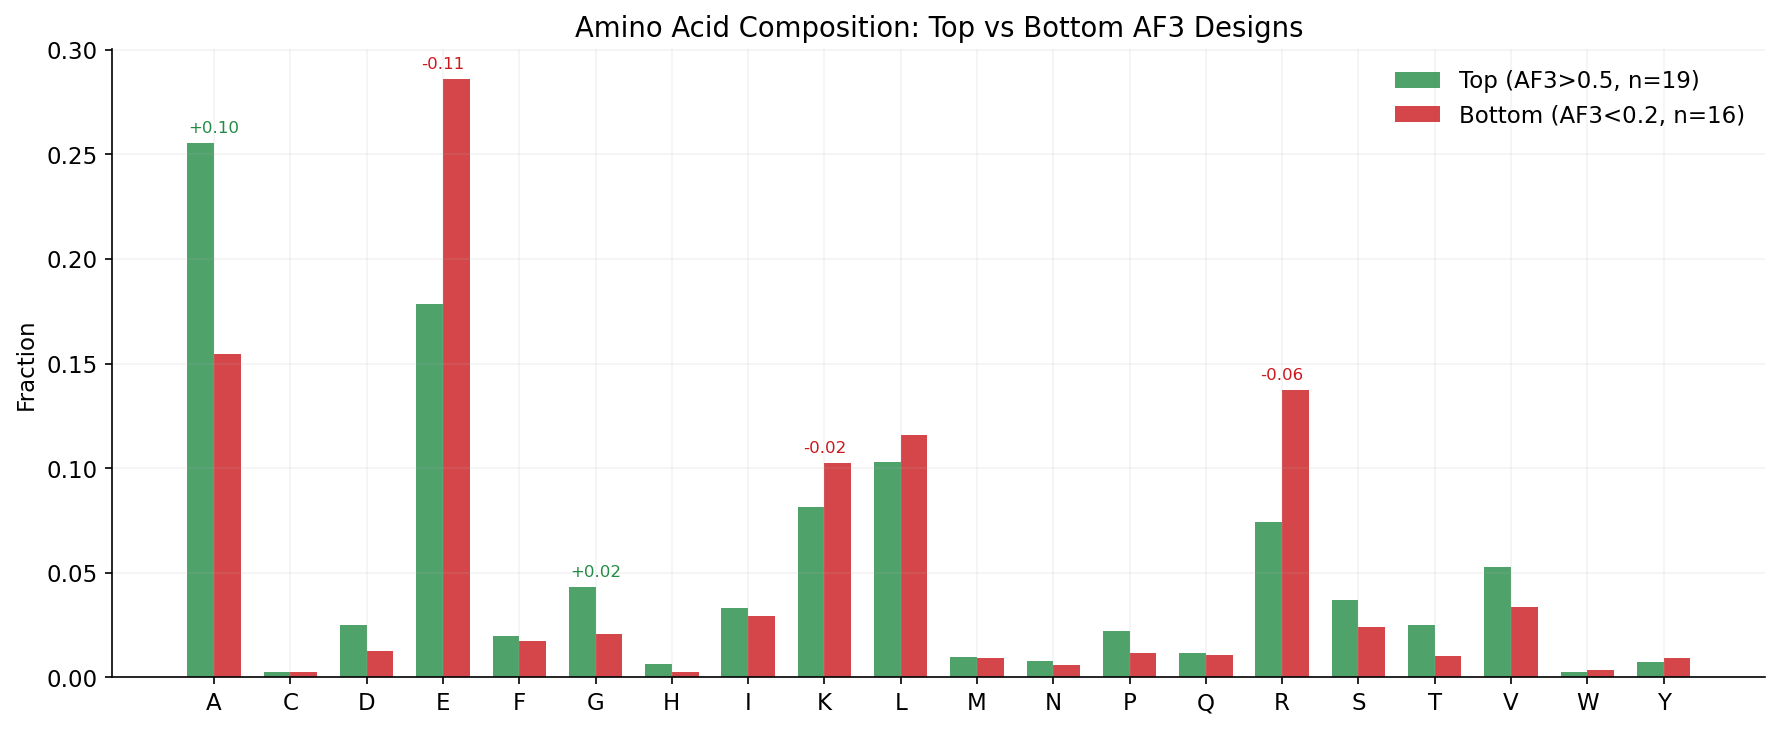
1. Aspartate (D) content is the strongest positive predictor of AF3 success (r=+0.35), while glutamate (E) is the strongest negative predictor (r=-0.33). BoltzGen designs tend to validate better in AF3, despite having lower Boltz-2 scores. This is the single strongest predictor of AF3 success.
2. Sequence diversity matters: designs with higher Shannon entropy (more diverse AA usage) and more unique amino acids tend to validate better. Low-complexity sequences rich in alanine and glycine consistently fail.
3. Aromatic residues (F, W, Y) are enriched in successful designs — these contribute to specific hydrophobic contacts at the interface that AF3 can validate.
4. High Boltz-2 ipTM is NOT predictive of AF3 success — in fact, it may be slightly anti-correlated. Designs with Boltz ipTM > 0.95 mostly fail AF3 validation (delta > 0.7).
5. Cullin-face designs show better AF3 agreement than E2-face designs, though the sample size is small. The one Cullin design tested (design_0357) has AF3 ipTM = 0.78 with low delta.
6. For future campaigns: prioritize BoltzGen-style generation, increase aromatic content in ProteinMPNN sampling, and reduce alanine/glycine bias. Consider Cullin-face targeting which appears more AF3-compatible.
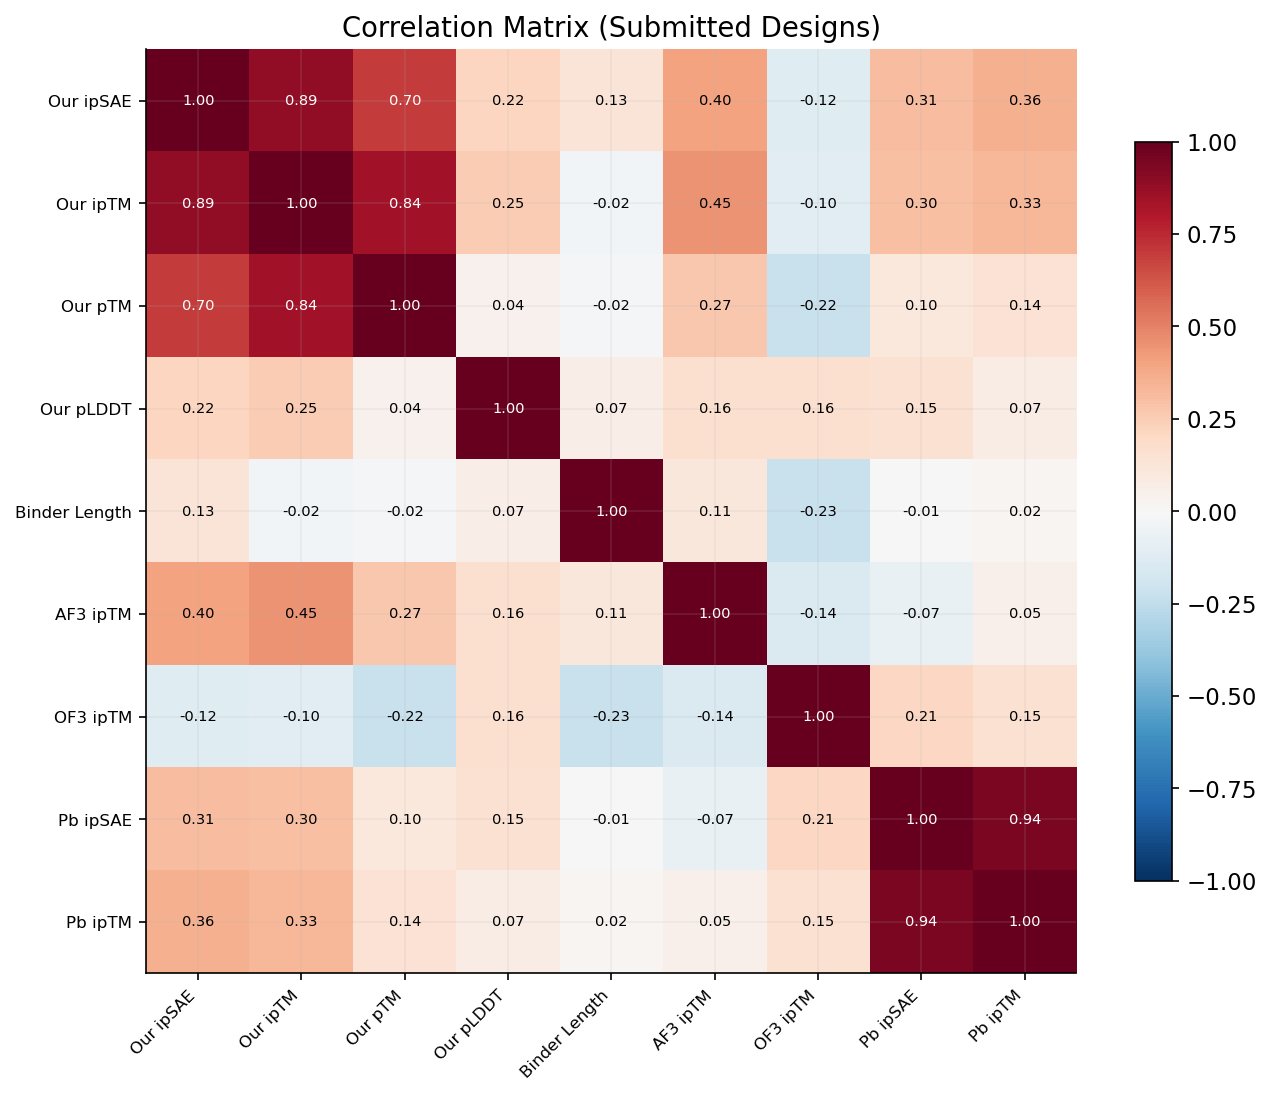
After submission, the ADAPTYV competition independently re-ran Boltz-2 on all 83 submitted designs and scored them with 12 structural metrics. We performed comprehensive feature engineering (64 features from sequence composition, structural propensities, Boltz-2 confidence maps, and our scoring metrics) and regression analysis to understand what predicts competition performance.
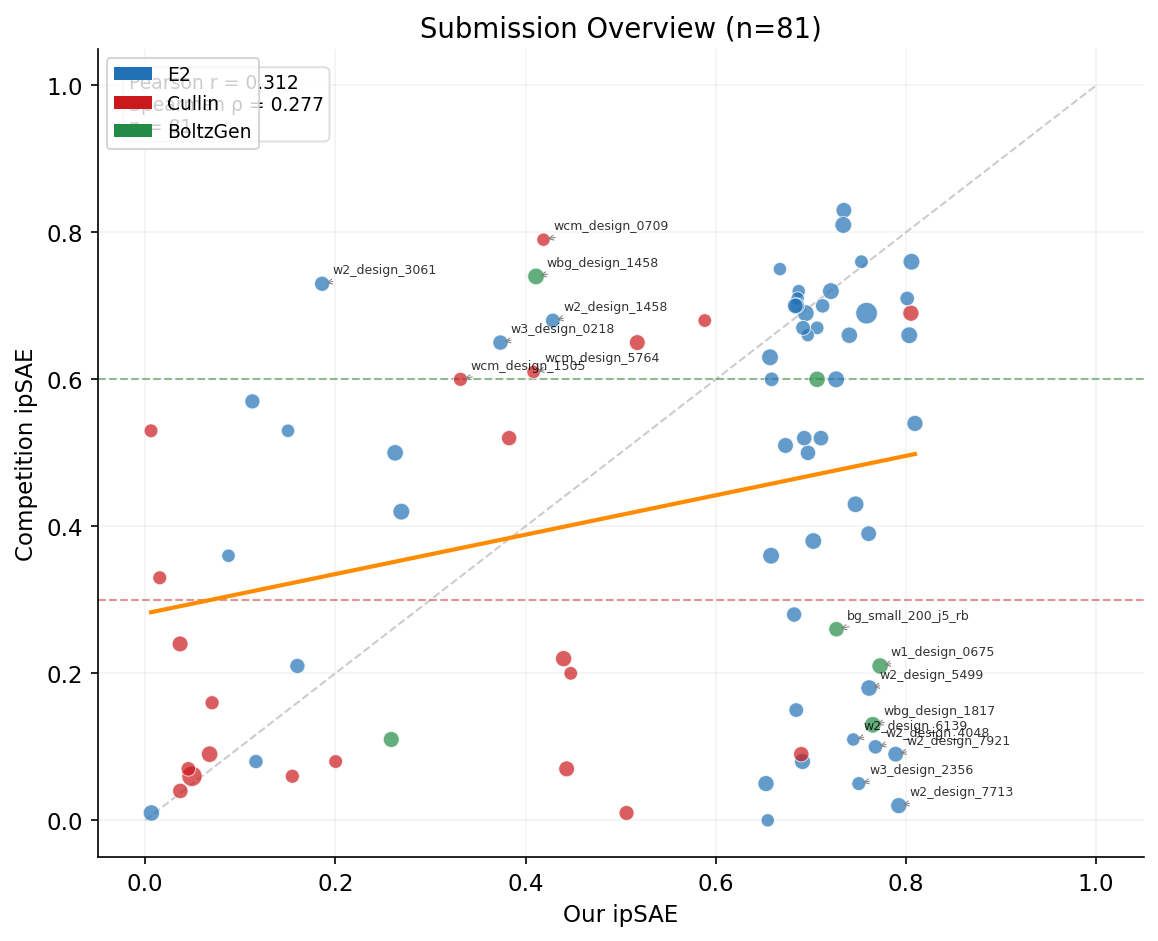
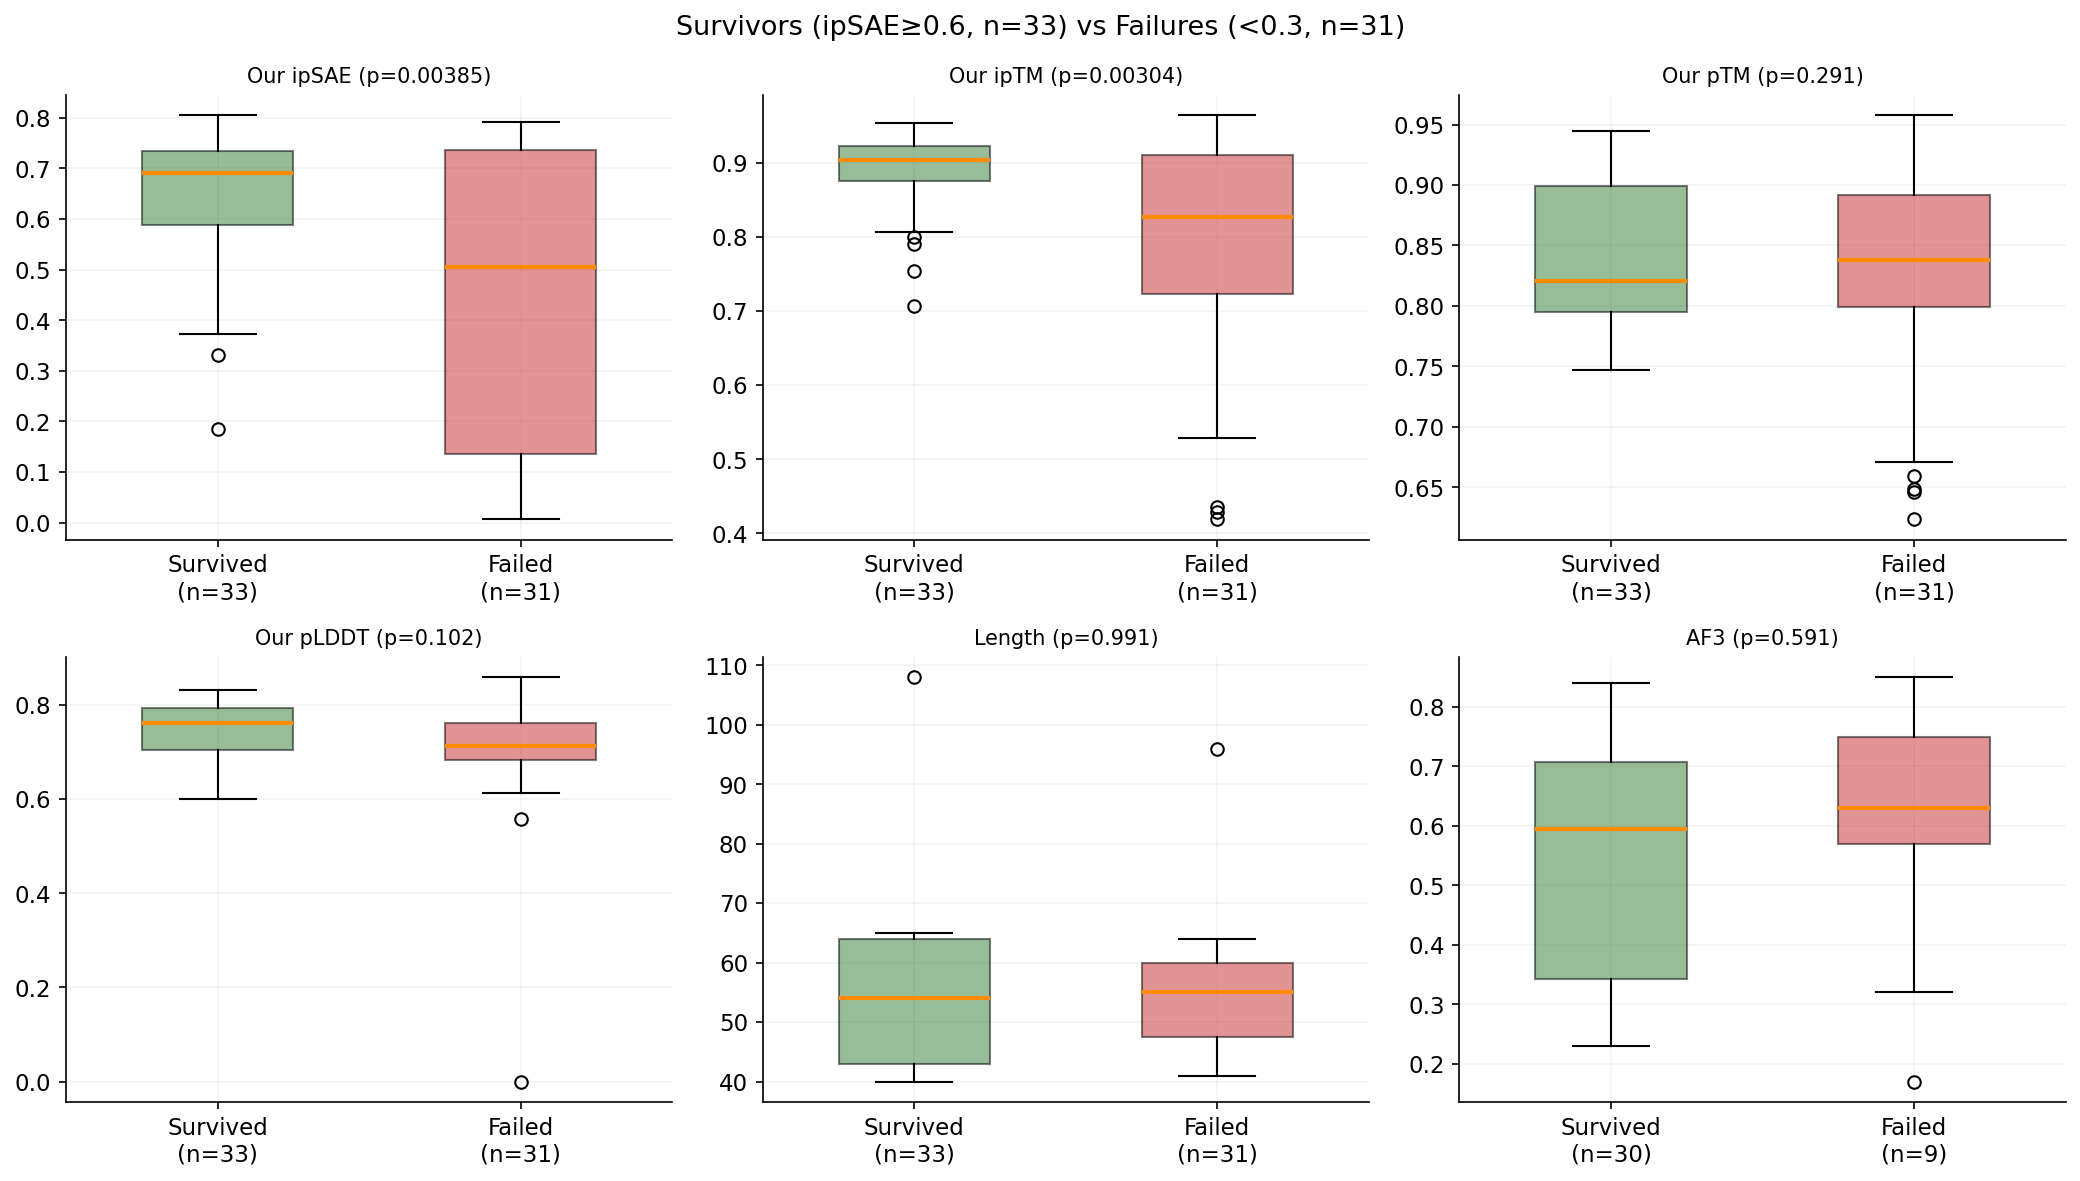
Of 83 submitted designs, 33 survived with their ipSAE ≥ 0.6 and 31 failed below 0.3. The submission included 30 designs with our ipSAE < 0.5 -- some performed surprisingly well in competition scoring. The correlation between our ipSAE and theirs is only r = 0.312, showing that internal scoring was a poor predictor of competition performance. Seven designs we scored below 0.5 actually survived (≥ 0.6) in the competition, while 9 designs we scored above 0.7 failed (< 0.3).
We extracted 64 features per design spanning four categories: (a) amino acid composition (20 individual AA fractions plus grouped fractions for charged, hydrophobic, polar, aromatic residues), (b) sequence properties (Shannon entropy, linguistic complexity, net charge, charge density, hydrophobicity, isoelectric point, molecular weight, max homopolymer repeat), (c) structural propensities (helix, sheet, disorder) and Boltz-2 PAE/pLDDT features from our prediction NPZ files (mean interface PAE, confident contacts, PAE asymmetry, binder pLDDT), and (d) design metadata (wave, face, binder length) plus our scoring metrics (ipSAE, ipTM, pTM, pLDDT, AF3 ipTM, OF3 ipTM). Structural features were extracted for 80 of 81 matched designs.
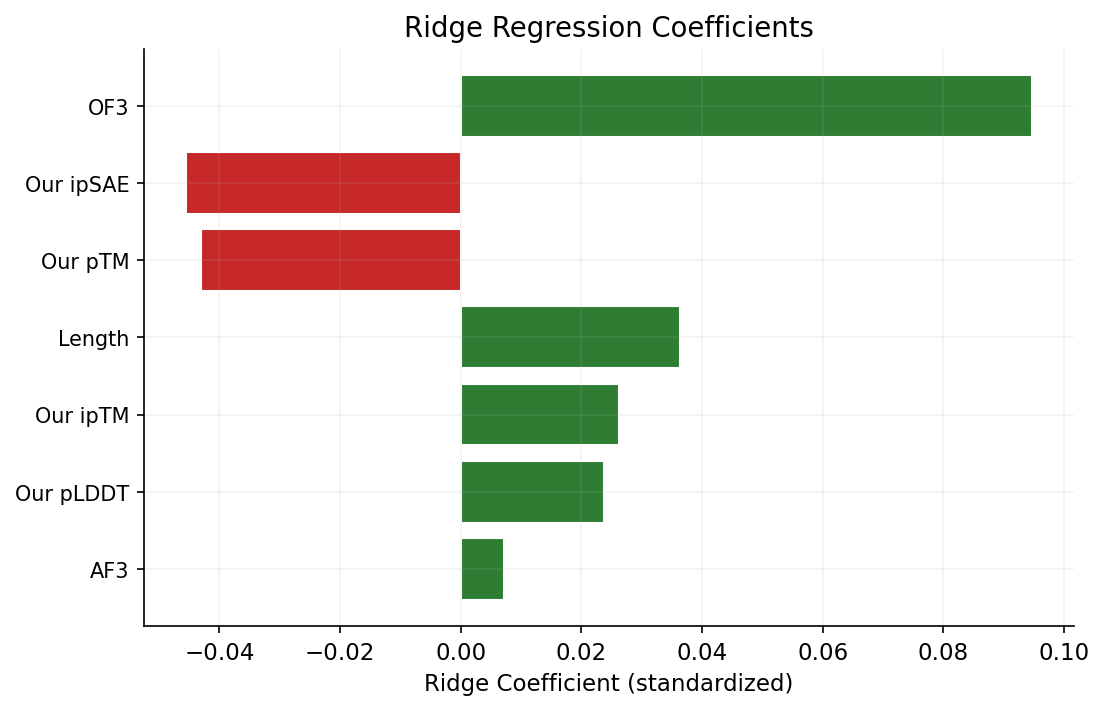
We trained three models to predict competition ipSAE from our 64 features. All models show negative cross-validated R2, indicating that with only 81 samples and 64 features, none generalizes reliably. Ridge regression (CV R2 = -2.22) heavily overfits. ElasticNet CV selects 22 non-zero features (CV R2 = -0.69, l1_ratio = 0.10). Random Forest is least negative (CV R2 = -0.33) and achieves train R2 = 0.78, suggesting nonlinear patterns exist but cannot be captured with this sample size. The negative CV R2 values confirm that no model beats predicting the mean -- individual competition scores are inherently unpredictable from our available features.
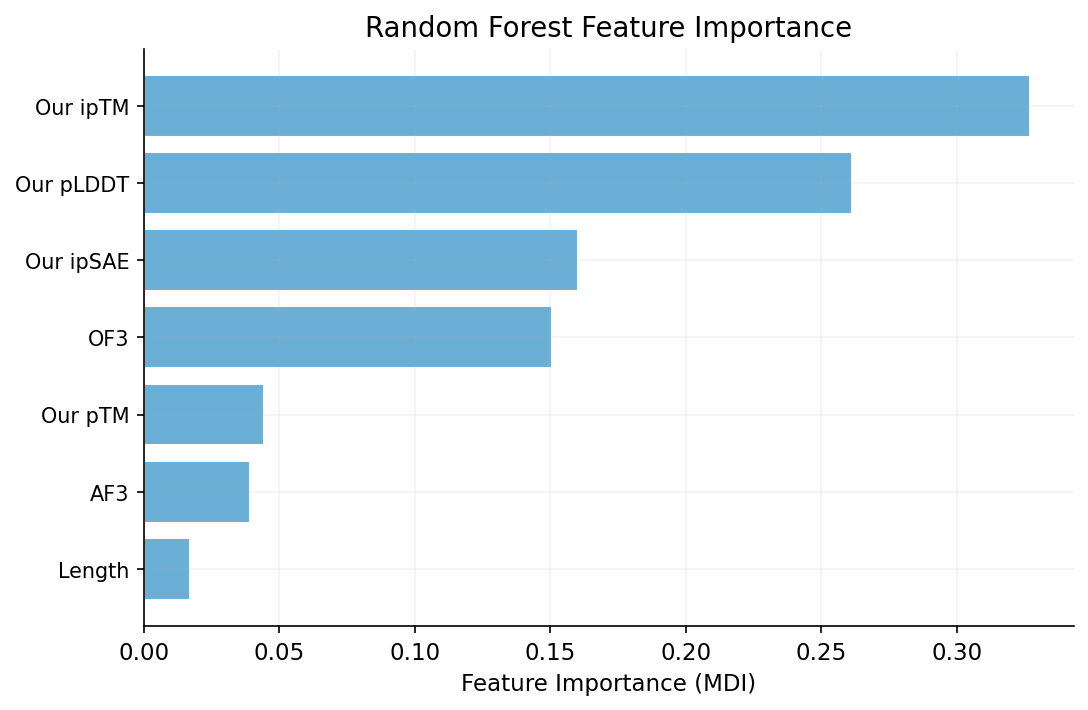
We compared 33 survivors (their ipSAE ≥ 0.6) against 31 failures (< 0.3) using Welch's t-test on all 64 features to find the most discriminating ones. The top 6 features are: net charge (p = 3.5e-5), isoelectric point (p = 3.4e-4), our ipTM (p = 0.003), our pTM (p = 0.003), charge density (p = 0.003), and our ipSAE (p = 0.004). All are statistically significant, but effect sizes are modest.
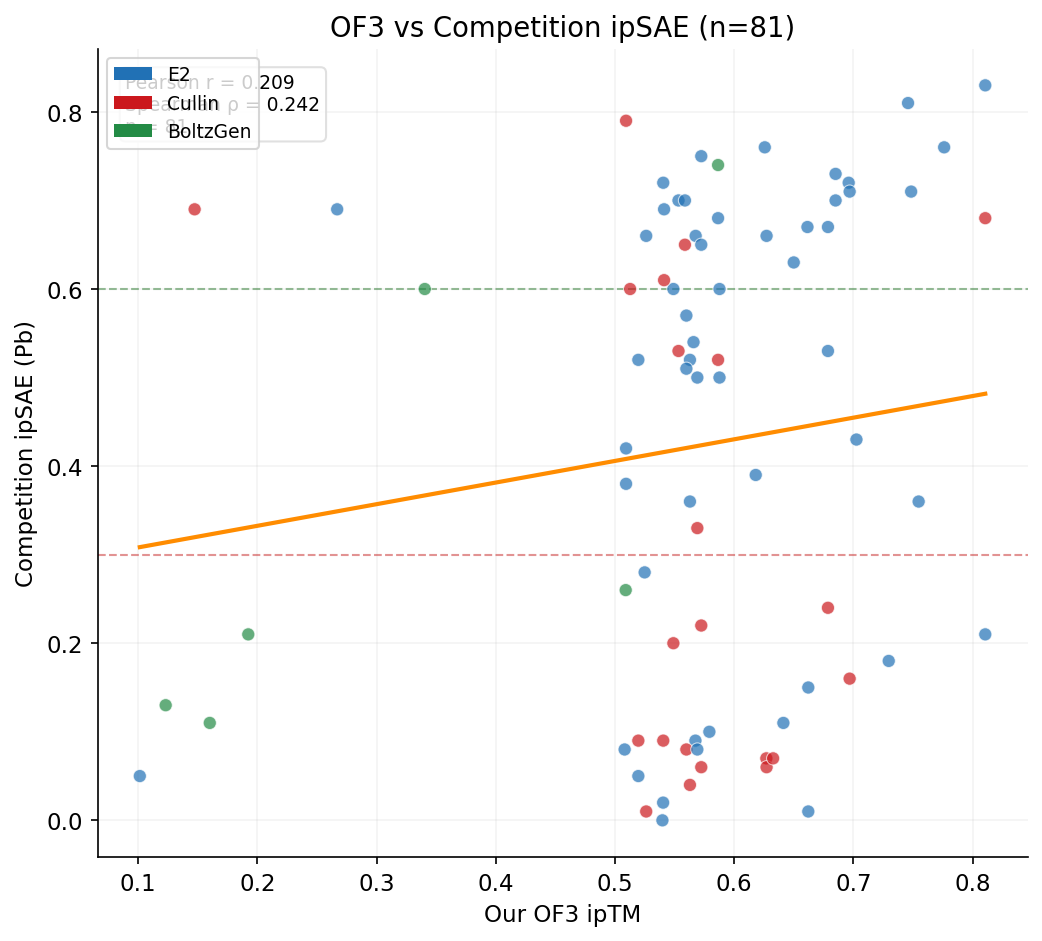
We tested whether our OpenFold3 ipTM scores predict competition ipSAE across the 81 designs with OF3 data. OF3 serves as an orthogonal validation method independent of Boltz-2.
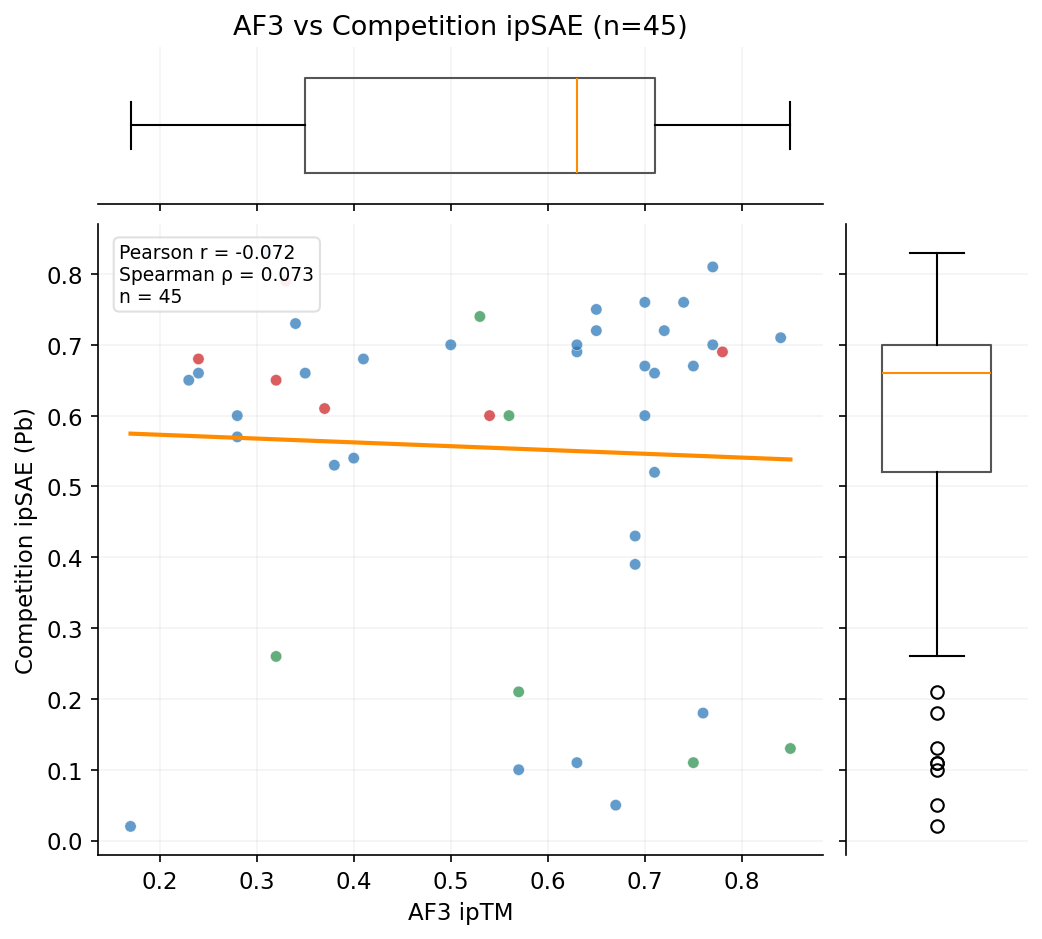
We tested whether our AlphaFold3 ipTM scores predict competition ipSAE across the designs with both AF3 and Pb data. AF3 serves as another orthogonal validation method independent of Boltz-2.
The most surprising finding is the extent of score reversals between our predictions and the competition's.
| Design | Our ipSAE | Their ipSAE | Surprise |
|---|---|---|---|
| wcm_design_0709 | 0.42 | 0.79 | We undervalued (+0.37) |
| wbg_design_1458 | 0.41 | 0.74 | We undervalued (+0.33) |
| w2_design_3061 | 0.19 | 0.73 | We undervalued (+0.54) |
| w2_design_7713 | 0.79 | 0.02 | We overvalued (-0.77) |
| w2_design_7921 | 0.79 | 0.09 | We overvalued (-0.70) |
| wbg_design_1817 | 0.77 | 0.13 | We overvalued (-0.64) |
| w3_design_2356 | 0.75 | 0.05 | We overvalued (-0.70) |
1. Competition ipSAE is not predictable from our features. All regression models yield negative cross-validated R2 (Ridge: -2.22, ElasticNet: -0.69, RF: -0.33), meaning they do worse than predicting the mean. With 81 samples and 64 features, overfitting is severe.
2. Net charge is the strongest single discriminator (p = 3.5e-5). Survivors have significantly more negative net charge than failures. This suggests the competition scoring penalizes positively charged / electrostatically sticky surfaces.
3. Our ipSAE and ipTM are statistically significant discriminators (p < 0.005) but with weak effect sizes (r ~ 0.3). High internal scores are weakly associated with competition survival but provide no guarantee.
4. Structural features from our Boltz-2 predictions (interface PAE, confident contacts) appear in the top Ridge coefficients, suggesting that PAE-derived interface quality has some predictive power even when overall scores do not correlate.
5. Score reversals are dramatic: w2_design_3061 scored 0.19 in our scoring but 0.73 in theirs (+0.54 reversal), while w2_design_7713 scored 0.79 in ours but only 0.02 in theirs (-0.77 reversal). This confirms Boltz-2 scores are not reproducible across runs.
6. The submission included 30 designs with our ipSAE < 0.5, yet 7 of them survived in competition scoring. This validates the diversity-over-optimization strategy: submitting a broad range of designs captures winners that would be missed by strict internal score cutoffs.
Trimming, alanine scanning, and mutational optimization of UBC12 (PDB 4P5O chain I) — the natural E2 binding partner of RBX1. All scoring via OpenFold3. Auto-updated: 2026-04-09 09:05
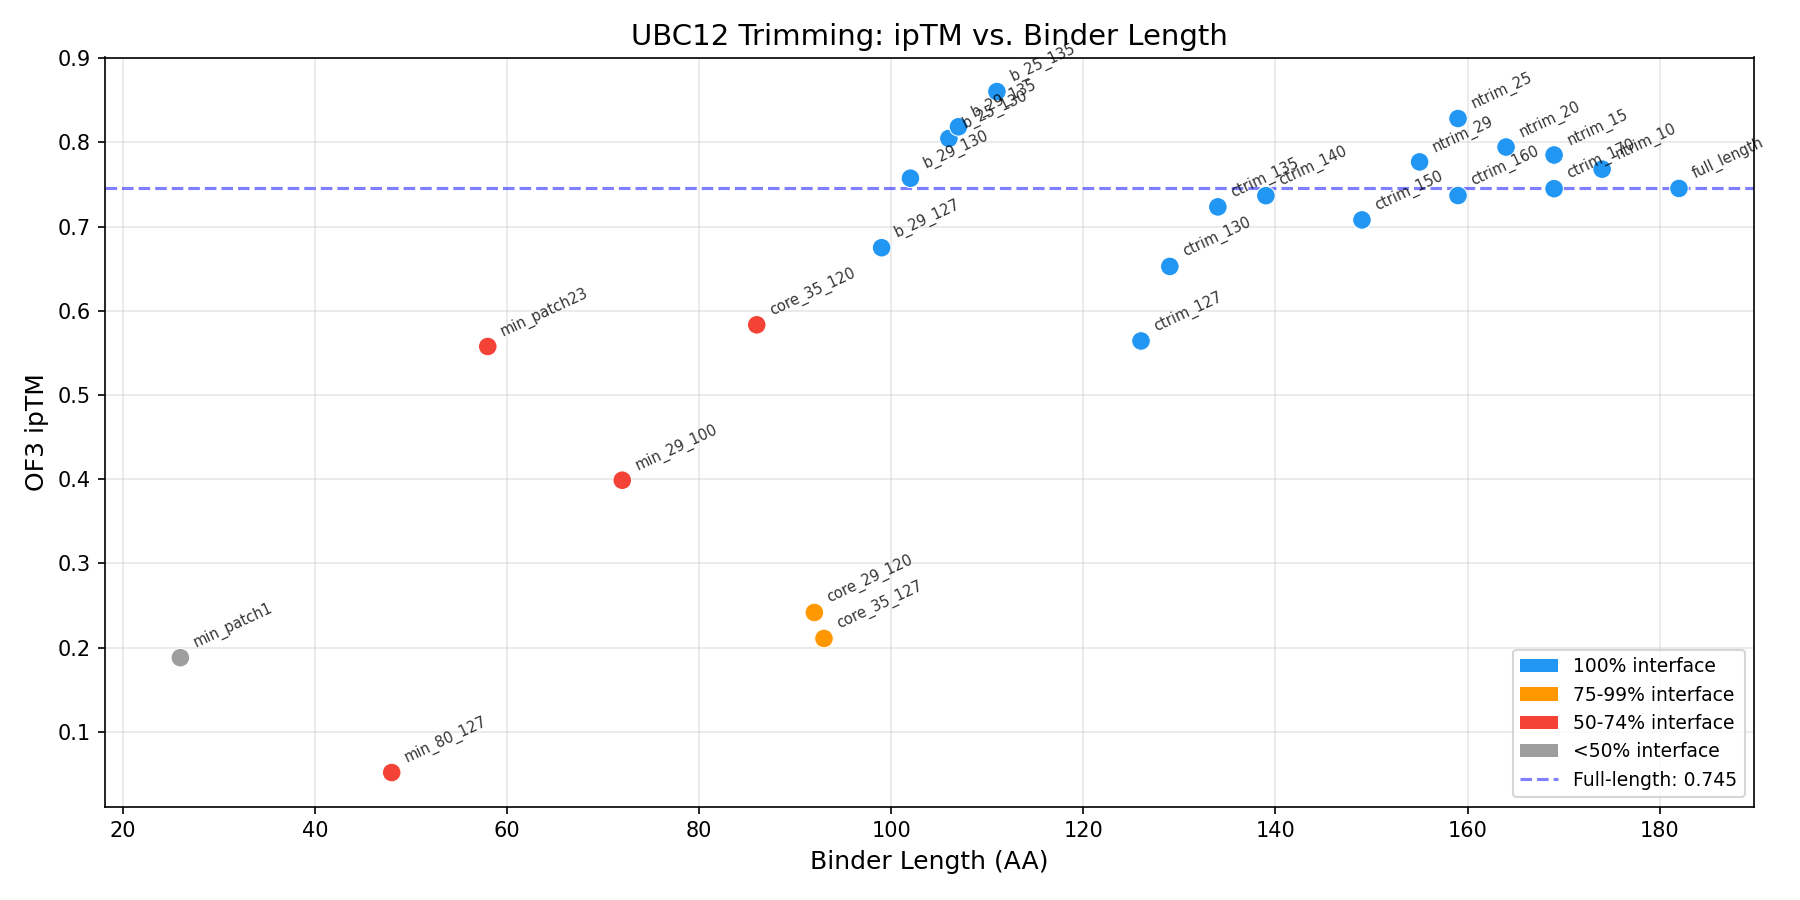
Best fragment: res 25-135 (111 AA) with OF3 ipTM = 0.860 (vs full-length 0.745). Trimming the disordered N-terminus improves binding by +0.115.
Show trimming results table
| Rk | Variant | Range | Len | Iface% | ipTM | pTM | pLDDT |
|---|---|---|---|---|---|---|---|
| 1 | both_25_135 | 25-135 | 111 | 100% | 0.8604 | 0.7470 | 81.8 |
| 2 | ntrim_25 | 25-183 | 159 | 100% | 0.8284 | 0.7925 | 84.4 |
| 3 | both_29_135 | 29-135 | 107 | 100% | 0.8186 | 0.7239 | 79.9 |
| 4 | both_25_130 | 25-130 | 106 | 100% | 0.8047 | 0.7111 | 78.3 |
| 5 | ntrim_20 | 20-183 | 164 | 100% | 0.7945 | 0.7799 | 82.8 |
| 6 | ntrim_15 | 15-183 | 169 | 100% | 0.7851 | 0.7732 | 82.9 |
| 7 | ntrim_29 | 29-183 | 155 | 100% | 0.7769 | 0.7716 | 82.6 |
| 8 | ntrim_10 | 10-183 | 174 | 100% | 0.7683 | 0.7593 | 81.9 |
| 9 | both_29_130 | 29-130 | 102 | 100% | 0.7575 | 0.6754 | 77.0 |
| 10 | full_length | 2-183 | 182 | 100% | 0.7454 | 0.7401 | 81.3 |
| 11 | ctrim_170 | 2-170 | 169 | 100% | 0.7451 | 0.7274 | 80.5 |
| 12 | ctrim_160 | 2-160 | 159 | 100% | 0.7369 | 0.7123 | 78.5 |
| 13 | ctrim_140 | 2-140 | 139 | 100% | 0.7368 | 0.6973 | 79.3 |
| 14 | ctrim_135 | 2-135 | 134 | 100% | 0.7234 | 0.6796 | 77.5 |
| 15 | ctrim_150 | 2-150 | 149 | 100% | 0.7080 | 0.6791 | 77.0 |
| 16 | both_29_127 | 29-127 | 99 | 100% | 0.6750 | 0.6330 | 73.1 |
| 17 | ctrim_130 | 2-130 | 129 | 100% | 0.6527 | 0.6296 | 73.8 |
| 18 | core_35_120 | 35-120 | 86 | 55% | 0.5834 | 0.5958 | 68.3 |
| 19 | ctrim_127 | 2-127 | 126 | 100% | 0.5642 | 0.5739 | 69.1 |
| 20 | minimal_patch23 | 78-135 | 58 | 59% | 0.5577 | 0.5355 | 69.1 |
| 21 | minimal_29_100 | 29-100 | 72 | 62% | 0.3988 | 0.4935 | 70.3 |
| 22 | core_29_120 | 29-120 | 92 | 76% | 0.2418 | 0.4013 | 59.6 |
| 23 | core_35_127 | 35-127 | 93 | 79% | 0.2109 | 0.3961 | 57.7 |
| 24 | minimal_patch1 | 25-50 | 26 | 41% | 0.1881 | 0.4512 | 59.8 |
| 25 | minimal_80_127 | 80-127 | 48 | 59% | 0.0517 | 0.3776 | 55.8 |
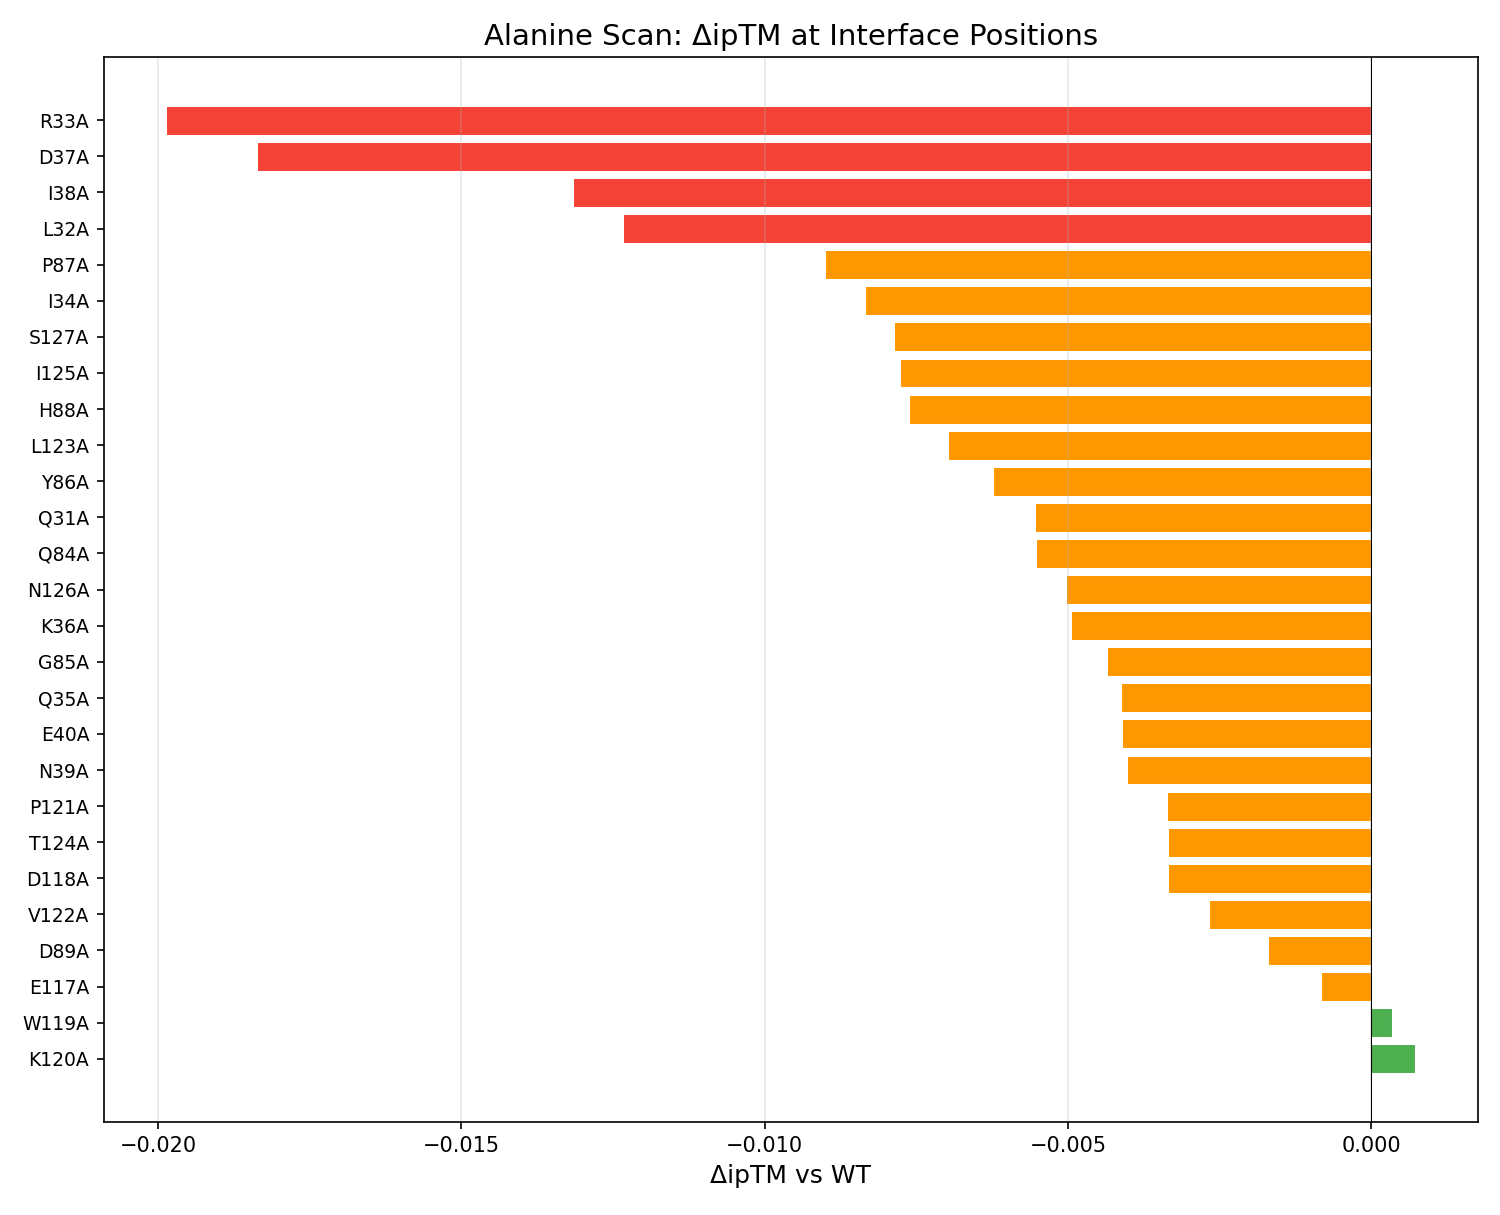
All 27 interface positions scanned. The interface is remarkably robust — no single Ala mutation drops ipTM by more than 0.02. Most tolerant: K120, W119, E117. Most sensitive: R33, D37.
Show alanine scan table
| Mutation | ipTM | ΔipTM | pTM | Class |
|---|---|---|---|---|
| ala_R33A | 0.8404 | -0.0199 | 0.7403 | neutral |
| ala_D37A | 0.8419 | -0.0184 | 0.7397 | neutral |
| ala_I38A | 0.8471 | -0.0132 | 0.7340 | neutral |
| ala_L32A | 0.8479 | -0.0123 | 0.7386 | neutral |
| ala_P87A | 0.8513 | -0.0090 | 0.7445 | neutral |
| ala_I34A | 0.8519 | -0.0083 | 0.7420 | neutral |
| ala_S127A | 0.8524 | -0.0079 | 0.7436 | neutral |
| ala_I125A | 0.8525 | -0.0078 | 0.7420 | neutral |
| ala_H88A | 0.8526 | -0.0076 | 0.7429 | neutral |
| ala_L123A | 0.8533 | -0.0070 | 0.7433 | neutral |
| ala_Y86A | 0.8540 | -0.0062 | 0.7440 | neutral |
| ala_Q31A | 0.8547 | -0.0055 | 0.7447 | neutral |
| ala_Q84A | 0.8547 | -0.0055 | 0.7478 | neutral |
| ala_N126A | 0.8552 | -0.0050 | 0.7472 | neutral |
| ala_K36A | 0.8553 | -0.0049 | 0.7472 | neutral |
| ala_G85A | 0.8559 | -0.0044 | 0.7480 | neutral |
| ala_Q35A | 0.8562 | -0.0041 | 0.7490 | neutral |
| ala_E40A | 0.8562 | -0.0041 | 0.7470 | neutral |
| ala_N39A | 0.8562 | -0.0040 | 0.7444 | neutral |
| ala_P121A | 0.8569 | -0.0034 | 0.7432 | neutral |
| ala_T124A | 0.8569 | -0.0034 | 0.7430 | neutral |
| ala_D118A | 0.8569 | -0.0033 | 0.7450 | neutral |
| ala_V122A | 0.8576 | -0.0027 | 0.7475 | neutral |
| ala_D89A | 0.8586 | -0.0017 | 0.7454 | neutral |
| ala_E117A | 0.8594 | -0.0008 | 0.7478 | neutral |
| wt_res25-135 | 0.8603 | +0.0000 | 0.7470 | neutral |
| ala_W119A | 0.8606 | +0.0003 | 0.7454 | neutral |
| ala_K120A | 0.8610 | +0.0007 | 0.7507 | neutral |
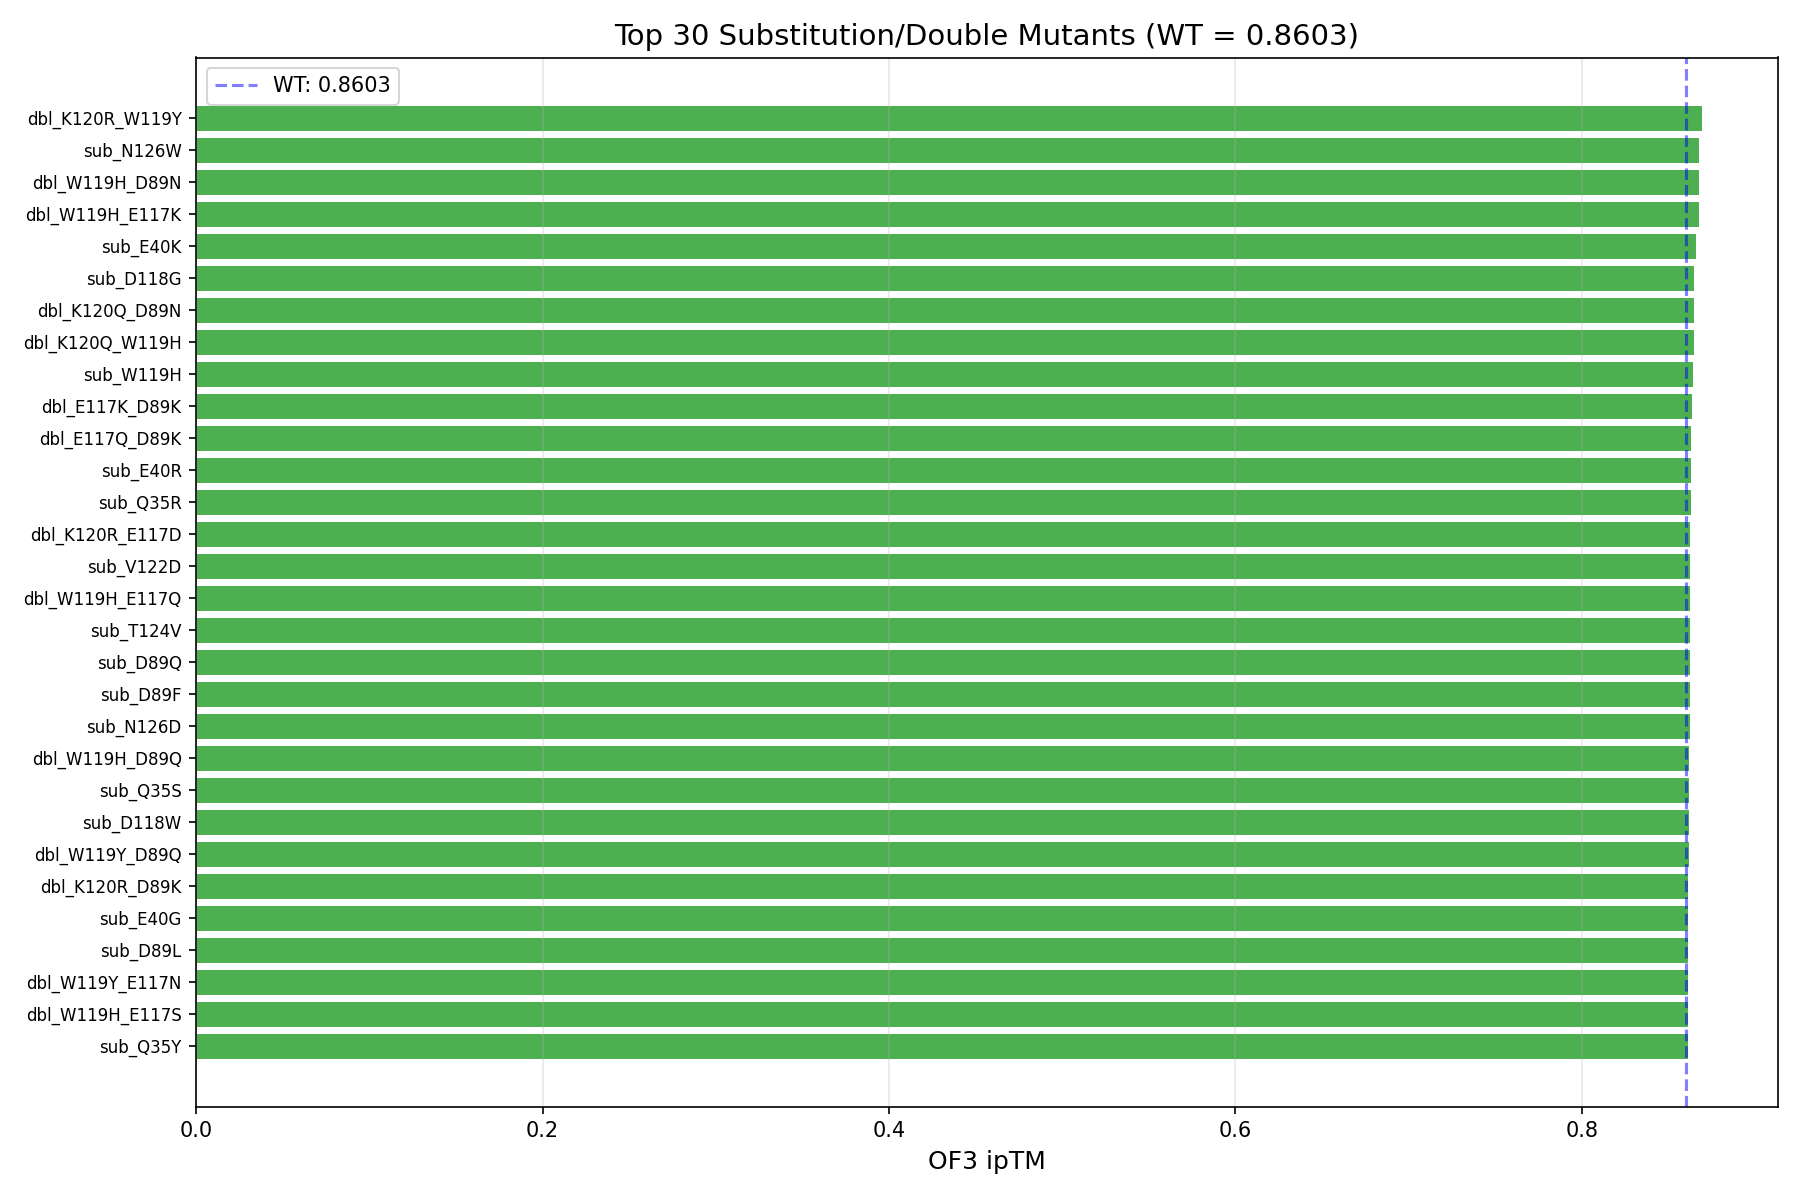
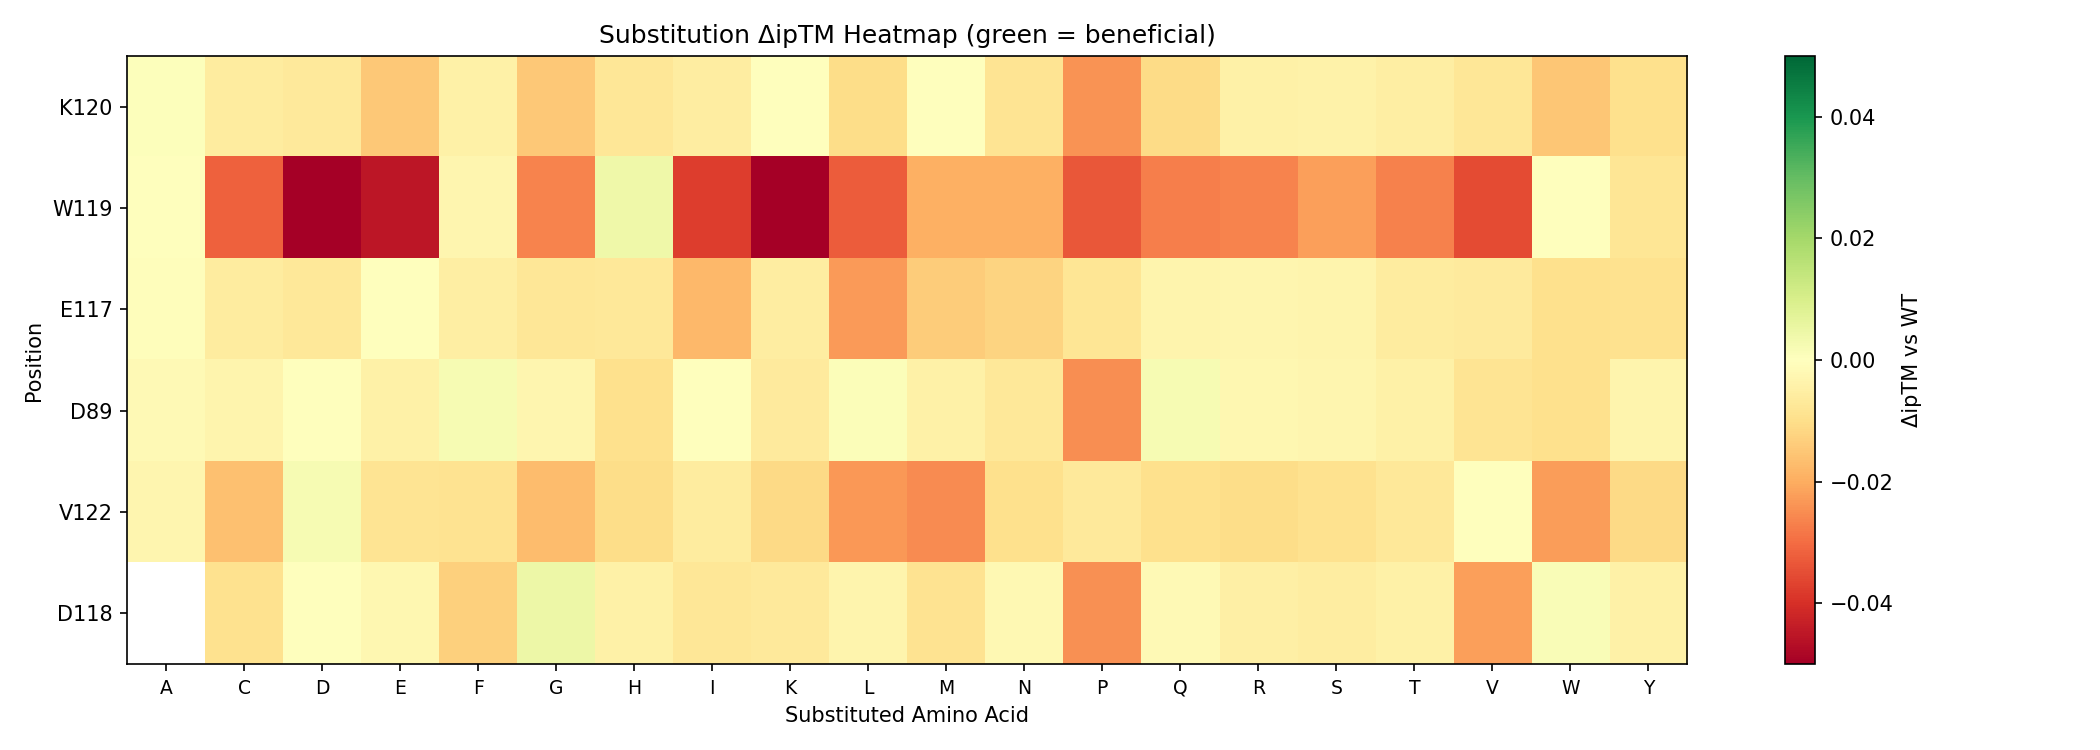
369 variants: 114 full-scan at 6 tolerant positions + 90 targeted at 6 moderate positions + 165 double mutants. 366 scored so far, 48 show improved ipTM over WT (0.8603).
| Rk | Mutation | Type | ipTM | ΔipTM | pTM | pLDDT | 3D |
|---|---|---|---|---|---|---|---|
| 1 | dbl_K120R_W119Y | Double | 0.8695 | +0.0092 | 0.7510 | 81.4 | |
| 2 | sub_N126W | Single | 0.8679 | +0.0076 | 0.7516 | 81.9 | |
| 3 | dbl_W119H_D89N | Double | 0.8676 | +0.0073 | 0.7499 | 81.8 | |
| 4 | dbl_W119H_E117K | Double | 0.8674 | +0.0072 | 0.7500 | 81.9 | |
| 5 | sub_E40K | Single | 0.8660 | +0.0057 | 0.7510 | 81.4 | |
| 6 | sub_D118G | Single | 0.8647 | +0.0044 | 0.7497 | 81.7 | |
| 7 | dbl_K120Q_D89N | Double | 0.8647 | +0.0044 | 0.7505 | 81.3 | |
| 8 | dbl_K120Q_W119H | Double | 0.8646 | +0.0043 | 0.7491 | 81.9 | |
| 9 | sub_W119H | Single | 0.8643 | +0.0040 | 0.7475 | 81.5 | |
| 10 | dbl_E117K_D89K | Double | 0.8634 | +0.0031 | 0.7486 | 80.9 | |
| 11 | dbl_E117Q_D89K | Double | 0.8630 | +0.0028 | 0.7487 | 81.1 | |
| 12 | sub_E40R | Single | 0.8630 | +0.0027 | 0.7515 | 81.5 | |
| 13 | sub_Q35R | Single | 0.8628 | +0.0025 | 0.7459 | 81.4 | |
| 14 | dbl_K120R_E117D | Double | 0.8626 | +0.0023 | 0.7476 | 81.0 | |
| 15 | sub_V122D | Single | 0.8626 | +0.0023 | 0.7490 | 81.0 | |
| 16 | dbl_W119H_E117Q | Double | 0.8625 | +0.0022 | 0.7478 | 81.6 | |
| 17 | sub_T124V | Single | 0.8624 | +0.0021 | 0.7482 | 81.4 | |
| 18 | sub_D89Q | Single | 0.8623 | +0.0020 | 0.7503 | 81.3 | |
| 19 | sub_D89F | Single | 0.8623 | +0.0020 | 0.7484 | 81.8 | |
| 20 | sub_N126D | Single | 0.8621 | +0.0019 | 0.7447 | 81.2 | |
| 21 | dbl_W119H_D89Q | Double | 0.8620 | +0.0017 | 0.7476 | 81.5 | |
| 22 | sub_Q35S | Single | 0.8620 | +0.0017 | 0.7480 | 81.5 | |
| 23 | sub_D118W | Single | 0.8618 | +0.0015 | 0.7480 | 81.6 | |
| 24 | dbl_W119Y_D89Q | Double | 0.8617 | +0.0015 | 0.7462 | 81.2 | |
| 25 | dbl_K120R_D89K | Double | 0.8615 | +0.0012 | 0.7480 | 81.4 | |
| 26 | sub_E40G | Single | 0.8615 | +0.0012 | 0.7480 | 81.6 | |
| 27 | sub_D89L | Single | 0.8614 | +0.0011 | 0.7477 | 81.7 | |
| 28 | dbl_W119Y_E117N | Double | 0.8613 | +0.0011 | 0.7438 | 81.6 | |
| 29 | dbl_W119H_E117S | Double | 0.8612 | +0.0009 | 0.7466 | 81.6 | |
| 30 | sub_Q35Y | Single | 0.8612 | +0.0009 | 0.7456 | 81.8 | |
| 31 | sub_E40W | Single | 0.8611 | +0.0008 | 0.7472 | 81.7 | |
| 32 | sub_K120A | Single | 0.8610 | +0.0007 | 0.7509 | 81.7 | |
| 33 | dbl_K120Q_E117S | Double | 0.8610 | +0.0007 | 0.7495 | 81.5 | |
| 34 | sub_N126Q | Single | 0.8610 | +0.0007 | 0.7511 | 81.5 | |
| 35 | dbl_K120N_W119F | Double | 0.8609 | +0.0006 | 0.7480 | 81.7 | |
| 36 | dbl_K120R_W119H | Double | 0.8609 | +0.0006 | 0.7438 | 81.3 | |
| 37 | dbl_K120D_D89S | Double | 0.8609 | +0.0006 | 0.7508 | 82.0 | |
| 38 | dbl_K120N_D89E | Double | 0.8608 | +0.0005 | 0.7463 | 81.5 | |
| 39 | dbl_K120H_D89K | Double | 0.8607 | +0.0005 | 0.7455 | 81.4 | |
| 40 | dbl_K120Q_D89K | Double | 0.8607 | +0.0004 | 0.7467 | 81.3 | |
| 41 | sub_T124K | Single | 0.8607 | +0.0004 | 0.7464 | 81.8 | |
| 42 | dbl_K120R_D89Q | Double | 0.8606 | +0.0004 | 0.7498 | 81.5 | |
| 43 | sub_T124E | Single | 0.8606 | +0.0003 | 0.7460 | 80.9 | |
| 44 | sub_D89I | Single | 0.8606 | +0.0003 | 0.7484 | 81.5 | |
| 45 | dbl_W119H_D89E | Double | 0.8606 | +0.0003 | 0.7447 | 81.3 | |
| 46 | dbl_E117D_D89N | Double | 0.8605 | +0.0002 | 0.7465 | 81.1 | |
| 47 | sub_K120M | Single | 0.8604 | +0.0001 | 0.7460 | 81.4 | |
| 48 | sub_W119A | Single | 0.8604 | +0.0001 | 0.7451 | 81.1 | |
| 49 | dbl_W119Y_E117D | Double | 0.8601 | -0.0002 | 0.7444 | 81.2 | |
| 50 | dbl_W119Y_D89K | Double | 0.8600 | -0.0002 | 0.7470 | 81.6 |