Mini-Fold — Protein Structure Diffusion Model
Full architecture history, training tables, loss functions, and analysis for the protein backbone diffusion model. View Structures Gallery →
Last updated: Mar 18, 2026 at 9:30 PM PST
FrameDiff v3: Paper-Correct SE(3) Backbone Diffusion
FrameDiff v3 — 24.9M params, 8 layers, CATH 4.3. TRAINING
Training Progress (selected epochs)
| Epoch | L_x | L_r | Rot Err | RMSD | Val Total | Notes |
|---|---|---|---|---|---|---|
| 0 | 2.044 | 0.908 | 77.8° | 12.73 A | 3.228 | |
| 10 | 1.300 | 0.681 | 68.1° | 9.80 A | 1.817 | |
| 20 | 1.280 | 0.656 | 66.7° | 9.64 A | 1.935 | |
| 30 | 1.288 | 0.650 | 66.4° | 9.63 A | 1.974 | |
| 40 | 1.264 | 0.642 | 65.9° | 9.53 A | 1.869 | |
| 50 | 1.242 | 0.637 | 65.6° | 9.43 A | 1.762 | |
| 60 | 1.223 | 0.634 | 65.3° | 9.35 A | 1.733 | |
| 70 | 1.219 | 0.632 | 65.3° | 9.34 A | 1.960 | |
| 80 | 1.212 | 0.629 | 65.0° | 9.29 A | 1.797 | |
| 90 | 1.214 | 0.626 | 64.8° | 9.26 A | 1.782 | |
| 100 | 1.197 | 349 | 64.8° | 9.18 A | 1.855 | L_r spike |
| 110 | 1.188 | 0.620 | 64.5° | 9.14 A | 1.866 | |
| 120 | 1.209 | 0.622 | 65.1° | 9.24 A | 1.701 | |
| 130 | 1.189 | 0.618 | 64.5° | 9.12 A | 1.770 | |
| 140 | 1.184 | 0.613 | 64.0° | 9.05 A | 1.782 | |
| 150 | 1.190 | 0.613 | 64.0° | 9.06 A | 1.662 | |
| 152 | 1.184 | 0.610 | 63.7° | 8.98 A | 1.602 | BEST |
| 160 | 1.177 | 0.610 | 63.7° | 9.02 A | 1.767 | |
| 170 | 1.179 | 0.612 | 64.0° | 9.02 A | 1.840 | |
| 180 | 1.175 | 0.607 | 63.5° | 8.96 A | 1.959 | |
| 190 | 1.180 | 0.610 | 63.8° | 9.00 A | 1.753 | |
| 200 | 1.204 | 0.617 | 64.2° | 9.12 A | 1.768 | |
| 210 | 1.194 | 0.620 | 64.6° | 9.17 A | 1.808 | |
| 220 | 1.185 | 0.616 | 64.2° | 9.07 A | 1.840 | |
| 230 | 1.195 | 0.620 | 64.7° | 9.15 A | 1.705 | |
| 233 | 1.208 | 0.619 | 64.6° | 9.16 A | 1.693 | |
| 234 | 1.180 | 0.612 | 63.6° | 9.01 A | 1.803 | |
| 235 | 1.196 | 0.618 | 64.4° | 9.13 A | 1.801 | Latest |
Last updated: Mar 20, 2026 at 08:36 AM PST. Epoch 235. Training ongoing (~13 min/epoch). 3 L_r spikes in 29 epochs (IGSO3 score at extreme angles).
Training Curves
Note: L_r spikes at epochs 2, 6, 7 (IGSO3 score instability at extreme angles) are excluded from charts. Val epoch 8 spike also excluded. Model converges stably — gradient clipping + NaN safety prevent divergence.
Loss Functions (Paper Sec. 4.2)
Total = Lx + Lr + 0.25 · 𝟙{t < 0.25} · (Lbb + L2D)
| Loss | Formula | Description |
|---|---|---|
| Lx | ||x̂(0) − x(0)||² | Translation MSE (Cα x0-prediction) |
| Lr | λr(t) · ||spred − strue||² | IGSO3 denoising score matching. s = (df/dω)/f · axis. λr = 1/E[||score||²] |
| Lbb | (1/4N)∑||â − a||² | Backbone atom MSE over {N, Cα, C, O}, gated at t < 0.25 |
| L2D | (1/Z)∑ 𝟙{d<6Å} · (d̂−d)² | All-atom pairwise distance MSE within 6Å cutoff, gated at t < 0.25 |
Model Configuration
Architecture Breakdown (Paper App. I.2, Fig. 2)
Each of L=8 refinement layers follows: IPA → LN → concat(hipa, Linear(h0)) → Transformer → Linear + residual → MLP → EdgeUpdate → BackboneUpdate
Paper Compliance Review
Automated review against Yim et al. 2302.02277v3. All core algorithms verified correct.
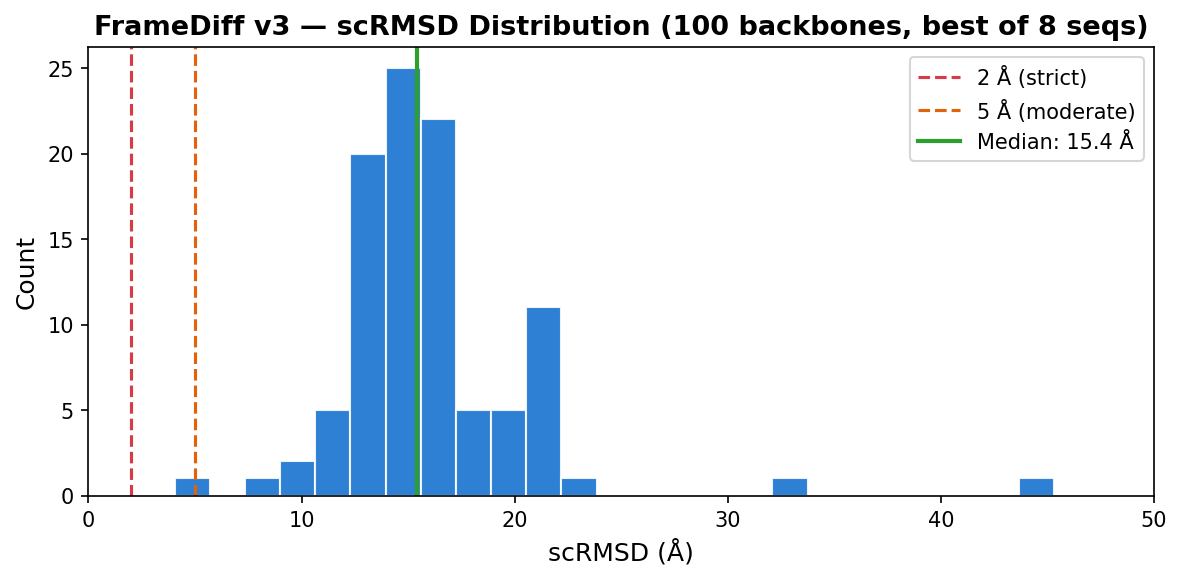
Designability Evaluation (100 backbones)
100× L=100 backbones, 500 reverse SDE steps, ζ=0.1. Each backbone sequence-designed with ProteinMPNN (8 seqs, temp=0.1, rm_aa=C) then validated with AlphaFold2 (model_1_ptm, 3 recycles). Metrics computed on best-of-8 AF2 predictions per backbone.
Best Designable Backbones (scRMSD < 10Å)
| Rank | MPNN | pLDDT | pTM | PAE | scRMSD (Å) | Best Sequence |
|---|---|---|---|---|---|---|
| 1 | 0.916 | 0.948 | 0.536 | 8.6 | 4.04 | LSGLLLLLLELLLLLLLLLLLELLLLLLLLLQLLLELLQLLLLLELLLLLLLLQLLLLLLLLLLLLLLLQLLLQLLLLLLLLQQQQLQQLLQLQLLLQLE |
| 2 | 1.452 | 0.875 | 0.649 | 5.5 | 8.70 | LLAGLLGLLLLLLLPLLLLLLLLLLAALLPELLLELLLLAALLLLLLLLLPLLLLLALLLLLLLLGLLLLLDPALALLLLLPLLLLLLLALLLLLELLLL |
Top: Generated backbone (poly-GLY). Bottom: AF2 prediction of best MPNN sequence. Drag to rotate, scroll to zoom.
Backbone — scRMSD=4.04Å
Backbone — scRMSD=8.70Å
AF2 prediction — pLDDT=0.948
AF2 prediction — pLDDT=0.875
Sequence Logos (MPNN-designed sequences)
Both backbones show strong leucine dominance with positional conservation of charged residues (E, K, Q). The best design (4.04Å) is almost entirely helical (L-rich), while the 2nd (8.70Å) shows more structural diversity with proline kinks and glycine turns.
Hourly Tracking (auto-generated)
17 samples over epochs ?. Showing 5 of 17 runs. One random sample per run, ProteinMPNN → AF2 designability.
| Time | Epoch | MPNN | pLDDT | pTM | PAE | RMSD |
|---|---|---|---|---|---|---|
| mar 18 10:23pm | ? | 1.311 | 0.823 | 0.532 | 9.7 | 29.0 |
| mar 19 12:23am | ? | 0.833 | 0.391 | 0.224 | 18.0 | 14.4 |
| mar 19 3:29am | ? | 0.748 | 0.357 | 0.176 | 19.8 | 15.1 |
| mar 19 5:31am | ? | 0.940 | 0.649 | 0.420 | 14.4 | 16.5 |
| mar 19 8:29am | ? | 1.162 | 0.446 | 0.257 | 17.7 | 14.9 |
mar 18 10:23pm
mar 19 12:23am
mar 19 3:29am
mar 19 5:31am
mar 19 8:29am
AF2
AF2
AF2
AF2
AF2
FrameDiff v4: Expanded Data Ablation
Same 24.9M model as v3, same schedule. max_len=512 → 17,547 train chains (vs v3's 10,125). Tests whether data size is the bottleneck. PENDING
Comparison: v3 vs v4
| v3 | v4 | |
|---|---|---|
| Model | 8L, 24.9M, d=256 | 8L, 24.9M, d=256 (identical) |
| Noise | σmax=1.5, βmax=20 | σmax=1.5, βmax=20 (identical) |
| Max length | 256 | 512 |
| Train chains | 10,125 | 17,547 (+73%) |
| Val chains | 448 | 580 |
| Hardware | 2× A40 | 2× A40 |
Training Progress
| Epoch | L_x | L_r | Rot Err | RMSD | Val Total | Notes |
|---|---|---|---|---|---|---|
| 0 | 2.109 | 9.461 | 76.0° | 12.75 A | 2.542 | |
| 5 | 1.560 | 0.682 | 68.1° | 10.58 A | 2.106 | |
| 10 | 1.523 | 0.660 | 66.8° | 10.41 A | 1.980 | |
| 12 | 1.524 | 0.655 | 66.5° | 10.36 A | 1.929 | BEST |
| 15 | 1.485 | 0.648 | 66.1° | 10.25 A | 2.096 | |
| 20 | 1.517 | 0.648 | 66.4° | 10.35 A | 2.013 | |
| 24 | 1.495 | 0.642 | 65.9° | 10.24 A | 2.044 | |
| 25 | 1.492 | 0.641 | 65.9° | 10.21 A | 2.030 | |
| 26 | 1.487 | 0.640 | 65.7° | 10.19 A | 2.160 | Latest |
Last updated: Mar 20, 2026 at 08:36 AM PST. Epoch 26. Training ongoing.
Training Curves
Charts will appear once training starts.
Designability Evaluation (96 backbones, epoch 0)
96× L=100 backbones, 500 reverse SDE steps, ζ=0.1. Each backbone sequence-designed with ProteinMPNN (8 seqs, temp=0.1, rm_aa=C) then validated with AlphaFold2 (model_1_ptm, 3 recycles). Metrics computed on best-of-8 AF2 predictions per backbone.
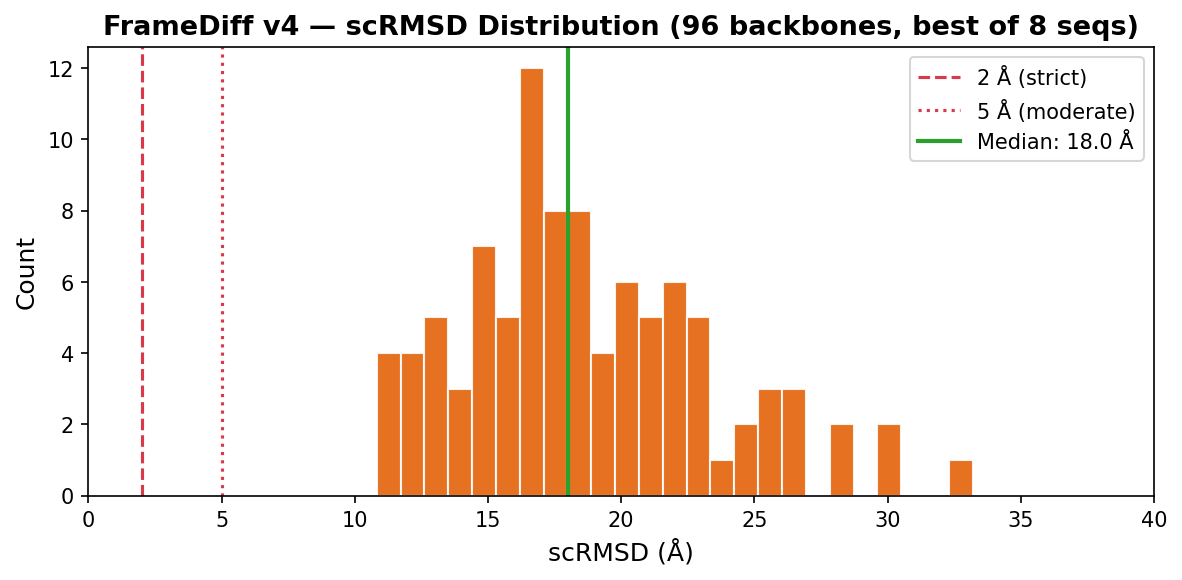
vs v3: v4 has higher AF2 confidence (49% scTM>0.5 vs 37%, 46% pLDDT>0.7 vs 26%) but worse self-consistency (median 18.0Å vs 15.4Å, 0% <10Å vs 3%). The expanded dataset (17.5K chains) produces more protein-like backbones that AF2 folds confidently — but into different structures. At epoch 0, the model hasn't converged enough for self-consistency.
Top 2 Designs (by scRMSD)
| Rank | MPNN | pLDDT | pTM | PAE | scRMSD (Å) | Best Sequence |
|---|---|---|---|---|---|---|
| 1 | 1.261 | 0.614 | 0.367 | 15.0 | 10.83 | AAEGAAAAALLAAGAAAAGAAAAEVGGGAAAAAAAGAGAGAAAALEAELAGKAAEEGGVAEAAEEEKELKEKVKEAELEEEILKKKKGGLAAGAGGGGGL |
| 2 | 1.355 | 0.624 | 0.459 | 13.0 | 11.24 | GGGGGGGGGGGGGGGGGGGGGGGGGGGGGGGGGGGGGGGGGGGGGGGGGGGGGGGGGGGGGGGGGGGGGGGGGGGGGGGGGGGGGGGGGGGGGGGGGG |
Top: Generated backbone. Bottom: AF2 prediction. Drag to rotate, scroll to zoom.
Backbone — scRMSD=10.83Å
Backbone — scRMSD=11.24Å
AF2 prediction — pLDDT=0.614
AF2 prediction — pLDDT=0.624
Sequence Logos (MPNN-designed sequences)
Hourly Tracking (auto-generated)
17 samples over epochs 12–?. Showing 5 of 17 runs. One random sample per run, ProteinMPNN → AF2 designability.
| Time | Epoch | MPNN | pLDDT | pTM | PAE | RMSD |
|---|---|---|---|---|---|---|
| mar 18 10:23pm | ? | 0.880 | 0.401 | 0.159 | 20.6 | 15.3 |
| mar 19 2:30am | ? | 1.534 | 0.754 | 0.397 | 16.6 | 13.7 |
| mar 19 6:29am | ? | 1.691 | 0.796 | 0.550 | 9.5 | 20.5 |
| mar 19 12:28pm | ? | 1.668 | 0.681 | 0.444 | 14.0 | 20.4 |
| mar 19 5:23pm | 12 | 1.890 | 0.607 | 0.347 | 14.6 | 20.5 |
mar 18 10:23pm
mar 19 2:30am
mar 19 6:29am
mar 19 12:28pm
mar 19 5:23pm
AF2
AF2
AF2
AF2
AF2
FrameDiff-Mini: Halved-Parameter SE(3) Diffusion
11.1M params, 6 layers, d_node=192, d_edge=96, d_ffn=768. Same CATH 4.3 data and losses as v3. 4× GPU. TRAINING
Training Progress
| Epoch | L_x | L_r | Rot Err | RMSD | Val Total | Notes |
|---|---|---|---|---|---|---|
| 0 | 2.063 | 0.919 | 78.2° | 12.85 A | 3.290 | |
| 10 | 1.315 | 0.686 | 68.2° | 9.78 A | 1.884 | |
| 20 | 1.285 | 3428 | 66.9° | 9.67 A | 1.981 | L_r spike |
| 30 | 1.254 | 79720 | 65.8° | 9.52 A | 1.889 | L_r spike |
| 40 | 1.243 | 0.644 | 66.0° | 9.47 A | 1.812 | |
| 50 | 1.262 | 0.645 | 66.1° | 9.51 A | 1.873 | |
| 60 | 1.223 | 0.636 | 65.2° | 9.36 A | 1.844 | |
| 70 | 1.234 | 0.636 | 65.6° | 9.39 A | 1.947 | |
| 76 | 1.220 | 0.633 | 65.3° | 9.31 A | 1.678 | BEST |
| 80 | 1.232 | 0.633 | 65.1° | 9.37 A | 1.893 | |
| 90 | 1.217 | 0.631 | 65.2° | 9.30 A | 1.920 | |
| 100 | 1.212 | 0.626 | 64.7° | 9.27 A | 1.856 | |
| 110 | 1.216 | 0.628 | 65.0° | 9.27 A | 1.754 | |
| 120 | 1.195 | 0.626 | 64.9° | 9.21 A | 1.811 | |
| 130 | 1.211 | 0.628 | 65.2° | 9.26 A | 1.969 | |
| 140 | 1.198 | 0.624 | 64.8° | 9.19 A | 1.819 | |
| 150 | 1.197 | 0.622 | 64.7° | 9.17 A | 1.794 | |
| 159 | 1.169 | 0.619 | 64.3° | 9.07 A | 1.918 | |
| 160 | 1.174 | 0.615 | 63.8° | 9.03 A | 1.956 | |
| 161 | 1.182 | 0.622 | 64.7° | 9.13 A | 1.880 | Latest |
Last updated: Mar 20, 2026 at 08:36 AM PST. Epoch 161. Training ongoing (~17 min/epoch).
Training Curves
Configuration
Generated Structures & Designability (epoch 21 checkpoint)
100-residue backbones, 500 steps, ζ=0.1. ProteinMPNN (8 seqs, temp=0.1) → AlphaFold2 (model_1_ptm, 3 recycles). Top row: generated backbone. Bottom row: AF2 prediction of best MPNN sequence.
| Sample | Best MPNN | pLDDT | pTM | PAE | RMSD (Å) | Best Sequence |
|---|---|---|---|---|---|---|
| 0 | 1.572 | 0.857 | 0.593 | 8.48 | 21.12 | ALGLLLLLLGLLALLLLLLLLPLLEGAELLEAAGLRLLAALLLLHRLLALLELLLELLLLALLLLGGLLLLLALAAALGELGLLLLLLPLLALLLLLLLG |
| 1 | 1.035 | 0.463 | 0.270 | 18.72 | 15.24 | AEALAAGAGGGLALGAALELLAAAGALGGGGGAAAAAGAGGGGGGGAAAGGGLAGGGGGGGAGGSLGAGTGGLGGGAAGAAGGGGGLGGLLGGAAAGAAG |
Backbone 0
Backbone 1
AF2 best 0
AF2 best 1
Hourly Tracking (auto-generated)
17 samples over epochs ?. Showing 5 of 17 runs. One random sample per run, ProteinMPNN → AF2 designability.
| Time | Epoch | MPNN | pLDDT | pTM | PAE | RMSD |
|---|---|---|---|---|---|---|
| mar 18 10:23pm | ? | 0.757 | 0.384 | 0.199 | 21.4 | 19.2 |
| mar 18 11:23pm | ? | 0.833 | 0.404 | 0.241 | 18.7 | 16.5 |
| mar 19 1:33am | ? | 0.801 | 0.375 | 0.200 | 20.2 | 16.2 |
| mar 19 3:29am | ? | 0.839 | 0.399 | 0.167 | 20.2 | 15.8 |
| mar 19 5:31am | ? | 0.798 | 0.453 | 0.278 | 21.1 | 17.3 |
mar 18 10:23pm
mar 18 11:23pm
mar 19 1:33am
mar 19 3:29am
mar 19 5:31am
AF2
AF2
AF2
AF2
AF2
FrameDiff-Tiny: Minimal SE(3) Diffusion
3.7M params, 4 layers, d_node=128, d_edge=64, d_ffn=512. Reduced noise: σmax=1.0, βmax=10.0. 1× GPU. TRAINING
Training Progress
| Epoch | L_x | L_r | Rot Err | RMSD | Val Total | Notes |
|---|---|---|---|---|---|---|
| 0 | 1.499 | 0.842 | 50.6° | 10.63 A | 2.720 | |
| 10 | 0.556 | 0.457 | 36.5° | 6.29 A | 1.001 | |
| 20 | 0.510 | 0.420 | 34.1° | 5.96 A | 0.923 | |
| 30 | 0.483 | 0.410 | 33.7° | 5.83 A | 0.868 | |
| 40 | 0.450 | 0.397 | 32.9° | 5.64 A | 0.885 | |
| 50 | 0.435 | 0.392 | 32.7° | 5.53 A | 0.843 | |
| 60 | 0.432 | 0.388 | 32.5° | 5.48 A | 0.829 | |
| 70 | 0.417 | 0.383 | 32.2° | 5.37 A | 0.883 | |
| 80 | 0.419 | 0.382 | 32.3° | 5.36 A | 0.843 | |
| 90 | 0.400 | 0.375 | 31.7° | 5.22 A | 0.875 | |
| 100 | 0.403 | 0.375 | 31.9° | 5.26 A | 0.856 | |
| 110 | 0.399 | 0.371 | 31.7° | 5.21 A | 0.871 | |
| 120 | 0.392 | 0.369 | 31.6° | 5.16 A | 0.814 | |
| 130 | 0.376 | 0.364 | 31.2° | 5.04 A | 0.832 | |
| 140 | 0.380 | 0.364 | 31.3° | 5.08 A | 0.824 | |
| 150 | 0.390 | 0.367 | 31.6° | 5.13 A | 0.832 | |
| 160 | 0.366 | 0.360 | 31.0° | 4.97 A | 0.859 | |
| 163 | 0.375 | 0.361 | 31.1° | 5.01 A | 0.689 | BEST |
| 165 | 0.383 | 0.365 | 31.4° | 5.08 A | 0.781 | |
| 166 | 0.373 | 0.361 | 31.1° | 5.02 A | 0.812 | |
| 167 | 0.378 | 0.360 | 31.1° | 5.03 A | 0.710 | Latest |
Last updated: Mar 20, 2026 at 08:36 AM PST. Epoch 167. Training ongoing.
Training Curves
Configuration
Generated Structures & Designability (best checkpoint)
100-residue backbones, 500 steps, ζ=0.1. ProteinMPNN (8 seqs, temp=0.1) → AlphaFold2 (model_1_ptm, 3 recycles). Top row: generated backbone. Bottom row: AF2 prediction of best MPNN sequence.
| Sample | Best MPNN | pLDDT | pTM | PAE | RMSD (Å) | Notes |
|---|---|---|---|---|---|---|
| 0 | 0.191 | 0.344 | 0.156 | 21.38 | 22.19 | >95% Glycine — failed |
| 1 | 0.298 | 0.369 | 0.149 | 21.95 | 20.48 | >95% Glycine — failed |
| 2 | 0.217 | 0.385 | 0.166 | 22.25 | 20.56 | >95% Glycine — failed |
| 3 | 0.184 | 0.359 | 0.154 | 21.33 | 20.91 | >95% Glycine — failed |
| 4 | 0.243 | 0.361 | 0.151 | 21.39 | 19.80 | >95% Glycine — failed |
All 5 samples produce >95% glycine sequences. MPNN cannot find valid sequences for these backbones — the geometry is not protein-like. AF2 predicts random coil (pLDDT ~0.35, pTM ~0.15).
Backbone 0
Backbone 1
Backbone 2
Backbone 3
Backbone 4
AF2 best 0
AF2 best 1
AF2 best 2
AF2 best 3
AF2 best 4
Hourly Tracking (auto-generated)
17 runs, all produced >95% glycine sequences (MPNN < 0.5). Backbones not designable.
Training Progress
Best structural: 2.324 at E60
60/60 epochs · final epoch best!
Best structural: 2.425 at E15
Stopped at E30 · pat 15/15
Best structural: 2.335 at E24
Stopped E37 · pat 13 (preemption)
Stopped E38 · pat 15/15
Frozen trunk · 156K trainable params
v13b — CA-only (from scratch, CLIP_PS=5.0, dist_head in optimizer)
| Epoch | Val Total | Structural | FAPE | Frame Rot | Dist MSE | Bond | Aux Dist | Chirality | Angle | Rg | Status |
|---|---|---|---|---|---|---|---|---|---|---|---|
| 9 | 2.608 | 2.599 | 1.675 | 0.841 | 0.357 | 0.008 | 0.302 | 0.375 | 0.137 | 0.038 | NEW BEST |
| 13 | 2.588 | 2.579 | 1.649 | 0.829 | 0.370 | 0.007 | 0.301 | 0.371 | 0.138 | 0.037 | NEW BEST |
| 17 | 2.551 | 2.542 | 1.641 | 0.826 | 0.352 | 0.006 | 0.306 | 0.356 | 0.129 | 0.036 | NEW BEST |
| 24 | 2.507 | 2.498 | 1.628 | 0.814 | 0.335 | 0.005 | 0.302 | 0.356 | 0.117 | 0.035 | NEW BEST |
| 28 | 2.487 | 2.475 | 1.604 | 0.810 | 0.339 | 0.006 | 0.423 | 0.345 | 0.113 | 0.035 | NEW BEST |
| 31 | 2.471 | 2.461 | 1.597 | 0.801 | 0.337 | 0.005 | 0.345 | 0.359 | 0.116 | 0.035 | NEW BEST |
| 40 | 2.465 | 2.456 | 1.597 | 0.797 | 0.335 | 0.006 | 0.309 | 0.352 | 0.111 | 0.034 | NEW BEST |
| 42 | 2.384 | 2.375 | 1.553 | 0.759 | 0.325 | 0.005 | 0.309 | 0.339 | 0.104 | 0.034 | NEW BEST |
| 54 | 2.380 | 2.371 | 1.564 | 0.773 | 0.322 | 0.005 | 0.288 | 0.339 | 0.106 | 0.034 | NEW BEST |
| 60 | 2.333 | 2.324 | 1.524 | 0.747 | 0.323 | 0.005 | 0.284 | 0.335 | 0.103 | 0.034 | NEW BEST · FINAL |
| Last 5 epochs | |||||||||||
| 56 | 2.405 | 2.371 | 1.552 | 0.778 | 0.342 | 0.005 | 0.286 | 0.338 | 0.106 | 0.034 | pat 2/15 |
| 57 | 2.388 | 2.371 | 1.563 | 0.767 | 0.328 | 0.005 | 0.286 | 0.337 | 0.105 | 0.034 | pat 3/15 |
| 58 | 2.396 | 2.371 | 1.557 | 0.775 | 0.333 | 0.005 | 0.285 | 0.337 | 0.105 | 0.034 | pat 4/15 |
| 59 | 2.389 | 2.371 | 1.562 | 0.776 | 0.325 | 0.005 | 0.285 | 0.337 | 0.105 | 0.034 | pat 5/15 |
| 60 | 2.333 | 2.324 | 1.524 | 0.747 | 0.323 | 0.005 | 0.284 | 0.335 | 0.103 | 0.034 | NEW BEST · FINAL |
v14 run2 — Full backbone, from scratch (early stopped)
| Epoch | Val Total | CA Structural | FAPE | Frame Rot | Dist MSE | BB FAPE | BB Bond | Omega | Status |
|---|---|---|---|---|---|---|---|---|---|
| 5 | 4.671 | 2.840 | 1.756 | 0.933 | 0.432 | 1.747 | 0.007 | 0.036 | NEW BEST |
| 8 | 4.311 | 2.623 | 1.645 | 0.843 | 0.410 | 1.635 | 0.005 | 0.022 | NEW BEST |
| 10 | 4.257 | 2.587 | 1.631 | 0.846 | 0.394 | 1.621 | 0.004 | 0.020 | NEW BEST |
| 15 | 4.017 | 2.425 | 1.558 | 0.785 | 0.350 | 1.549 | 0.004 | 0.017 | NEW BEST |
| Final epochs | |||||||||
| 26 | 4.132 | 2.523 | 1.579 | 0.817 | 0.415 | 1.569 | 0.004 | 0.015 | pat 11/15 |
| 27 | 4.108 | 2.509 | 1.571 | 0.808 | 0.417 | 1.560 | 0.003 | 0.014 | pat 12/15 |
| 28 | 4.160 | 2.535 | 1.598 | 0.824 | 0.407 | 1.587 | 0.003 | 0.013 | pat 13/15 |
| 29 | 4.219 | 2.578 | 1.614 | 0.837 | 0.428 | 1.603 | 0.004 | 0.013 | pat 14/15 |
| 30 | 4.241 | 2.594 | 1.621 | 0.836 | 0.438 | 1.610 | 0.003 | 0.013 | EARLY STOP |
v14 run3 — Restarted from E15, BB_LR 2x + L2 offset reg (w=0.1)
| Epoch | Val Total | CA Structural | FAPE | Frame Rot | Dist MSE | BB FAPE | BB Bond | Omega | Status |
|---|---|---|---|---|---|---|---|---|---|
| 24 | 3.865 | 2.335 | 1.500 | 0.743 | 0.350 | 1.492 | 0.003 | 0.013 | NEW BEST |
| Recent epochs | |||||||||
| 30 | 4.043 | 2.466 | 1.548 | 0.787 | 0.409 | 1.539 | 0.003 | 0.013 | pat 6/15 |
| 31 | 3.998 | 2.425 | 1.544 | 0.784 | 0.375 | 1.535 | 0.003 | 0.013 | pat 7/15 |
| 32 | 3.983 | 2.426 | 1.530 | 0.784 | 0.392 | 1.521 | 0.003 | 0.013 | pat 8/15 |
| 33 | 3.955 | 2.402 | 1.525 | 0.768 | 0.390 | 1.516 | 0.003 | 0.013 | pat 9/15 |
| 34 | 4.001 | 2.429 | 1.544 | 0.796 | 0.378 | 1.535 | 0.003 | 0.013 | pat 10/15 |
| 35 | 3.990 | 2.514 | 1.566 | 0.820 | 0.390 | 1.557 | 0.003 | 0.013 | pat 11/15 |
| 36 | 4.022 | 2.469 | 1.557 | 0.793 | 0.401 | 1.548 | 0.003 | 0.013 | pat 12/15 |
| 37 | 4.045 | 2.502 | 1.552 | 0.796 | 0.414 | 1.543 | 0.003 | 0.013 | pat 13/15 |
v15 — Full backbone + pLDDT + pAE confidence heads
Frozen trunk (v14 run3 E24 weights). Only pLDDT + pAE heads trainable (156K params). LR 1e-4, w_plddt=0.2, w_pae=0.2. Structural quality preserved from v14 run3.
| Epoch | Val Total | CA Structural | FAPE | Frame Rot | Dist MSE | BB FAPE | pLDDT | pAE | DDIM TM | Status |
|---|---|---|---|---|---|---|---|---|---|---|
| Frozen trunk — only pLDDT + pAE heads trainable (156K params). LR 1e-4. Structural losses logged but not optimized. | ||||||||||
| 1 | 4.322 | 2.335 | 1.623 | 0.839 | 0.431 | 1.613 | 3.130 | 3.818 | 0.100 | NEW BEST |
| 2 | 4.205 | 2.335 | 1.600 | 0.827 | 0.421 | 1.590 | 3.023 | 3.781 | — | NEW BEST |
| 3 | 4.143 | 2.335 | 1.597 | 0.821 | 0.415 | 1.587 | 2.983 | 3.757 | — | NEW BEST |
| 4 | 4.095 | 2.335 | 1.601 | 0.826 | 0.410 | 1.591 | 2.993 | 3.744 | — | NEW BEST |
| 5 | 4.075 | 2.335 | 1.598 | 0.820 | 0.412 | 1.588 | 2.989 | 3.743 | 0.102 | NEW BEST |
| 6 | 4.036 | 2.335 | 1.595 | 0.818 | 0.408 | 1.586 | 2.954 | 3.756 | — | NEW BEST |
| 7 | 4.015 | 2.335 | 1.597 | 0.822 | 0.405 | 1.587 | 2.938 | 3.757 | — | pat 1/15 |
| 8 | 3.994 | 2.335 | 1.599 | 0.821 | 0.403 | 1.589 | 2.963 | 3.736 | — | pat 2/15 |
| 9 | 3.986 | 2.335 | 1.601 | 0.823 | 0.401 | 1.591 | 2.953 | 3.754 | — | pat 3/15 |
| 10 | 3.972 | 2.335 | 1.598 | 0.819 | 0.403 | 1.588 | 2.944 | 3.752 | 0.101 | NEW BEST |
| 11 | 3.958 | 2.335 | 1.600 | 0.820 | 0.400 | 1.590 | 2.933 | 3.759 | — | NEW BEST |
| 12 | 3.945 | 2.335 | 1.598 | 0.818 | 0.402 | 1.588 | 2.929 | 3.750 | — | NEW BEST |
| 13 | 3.940 | 2.335 | 1.599 | 0.819 | 0.401 | 1.589 | 2.945 | 3.747 | — | pat 1/15 |
| 14 | 3.936 | 2.335 | 1.600 | 0.820 | 0.400 | 1.590 | 2.940 | 3.749 | — | pat 2/15 |
| 15 | 3.934 | 2.335 | 1.601 | 0.821 | 0.399 | 1.591 | 2.962 | 3.737 | 0.102 | pat 3/15 |
| 16 | 3.930 | 2.335 | 1.600 | 0.819 | 0.400 | 1.590 | 2.956 | 3.736 | — | pat 4/15 |
Loss Curves — All Models
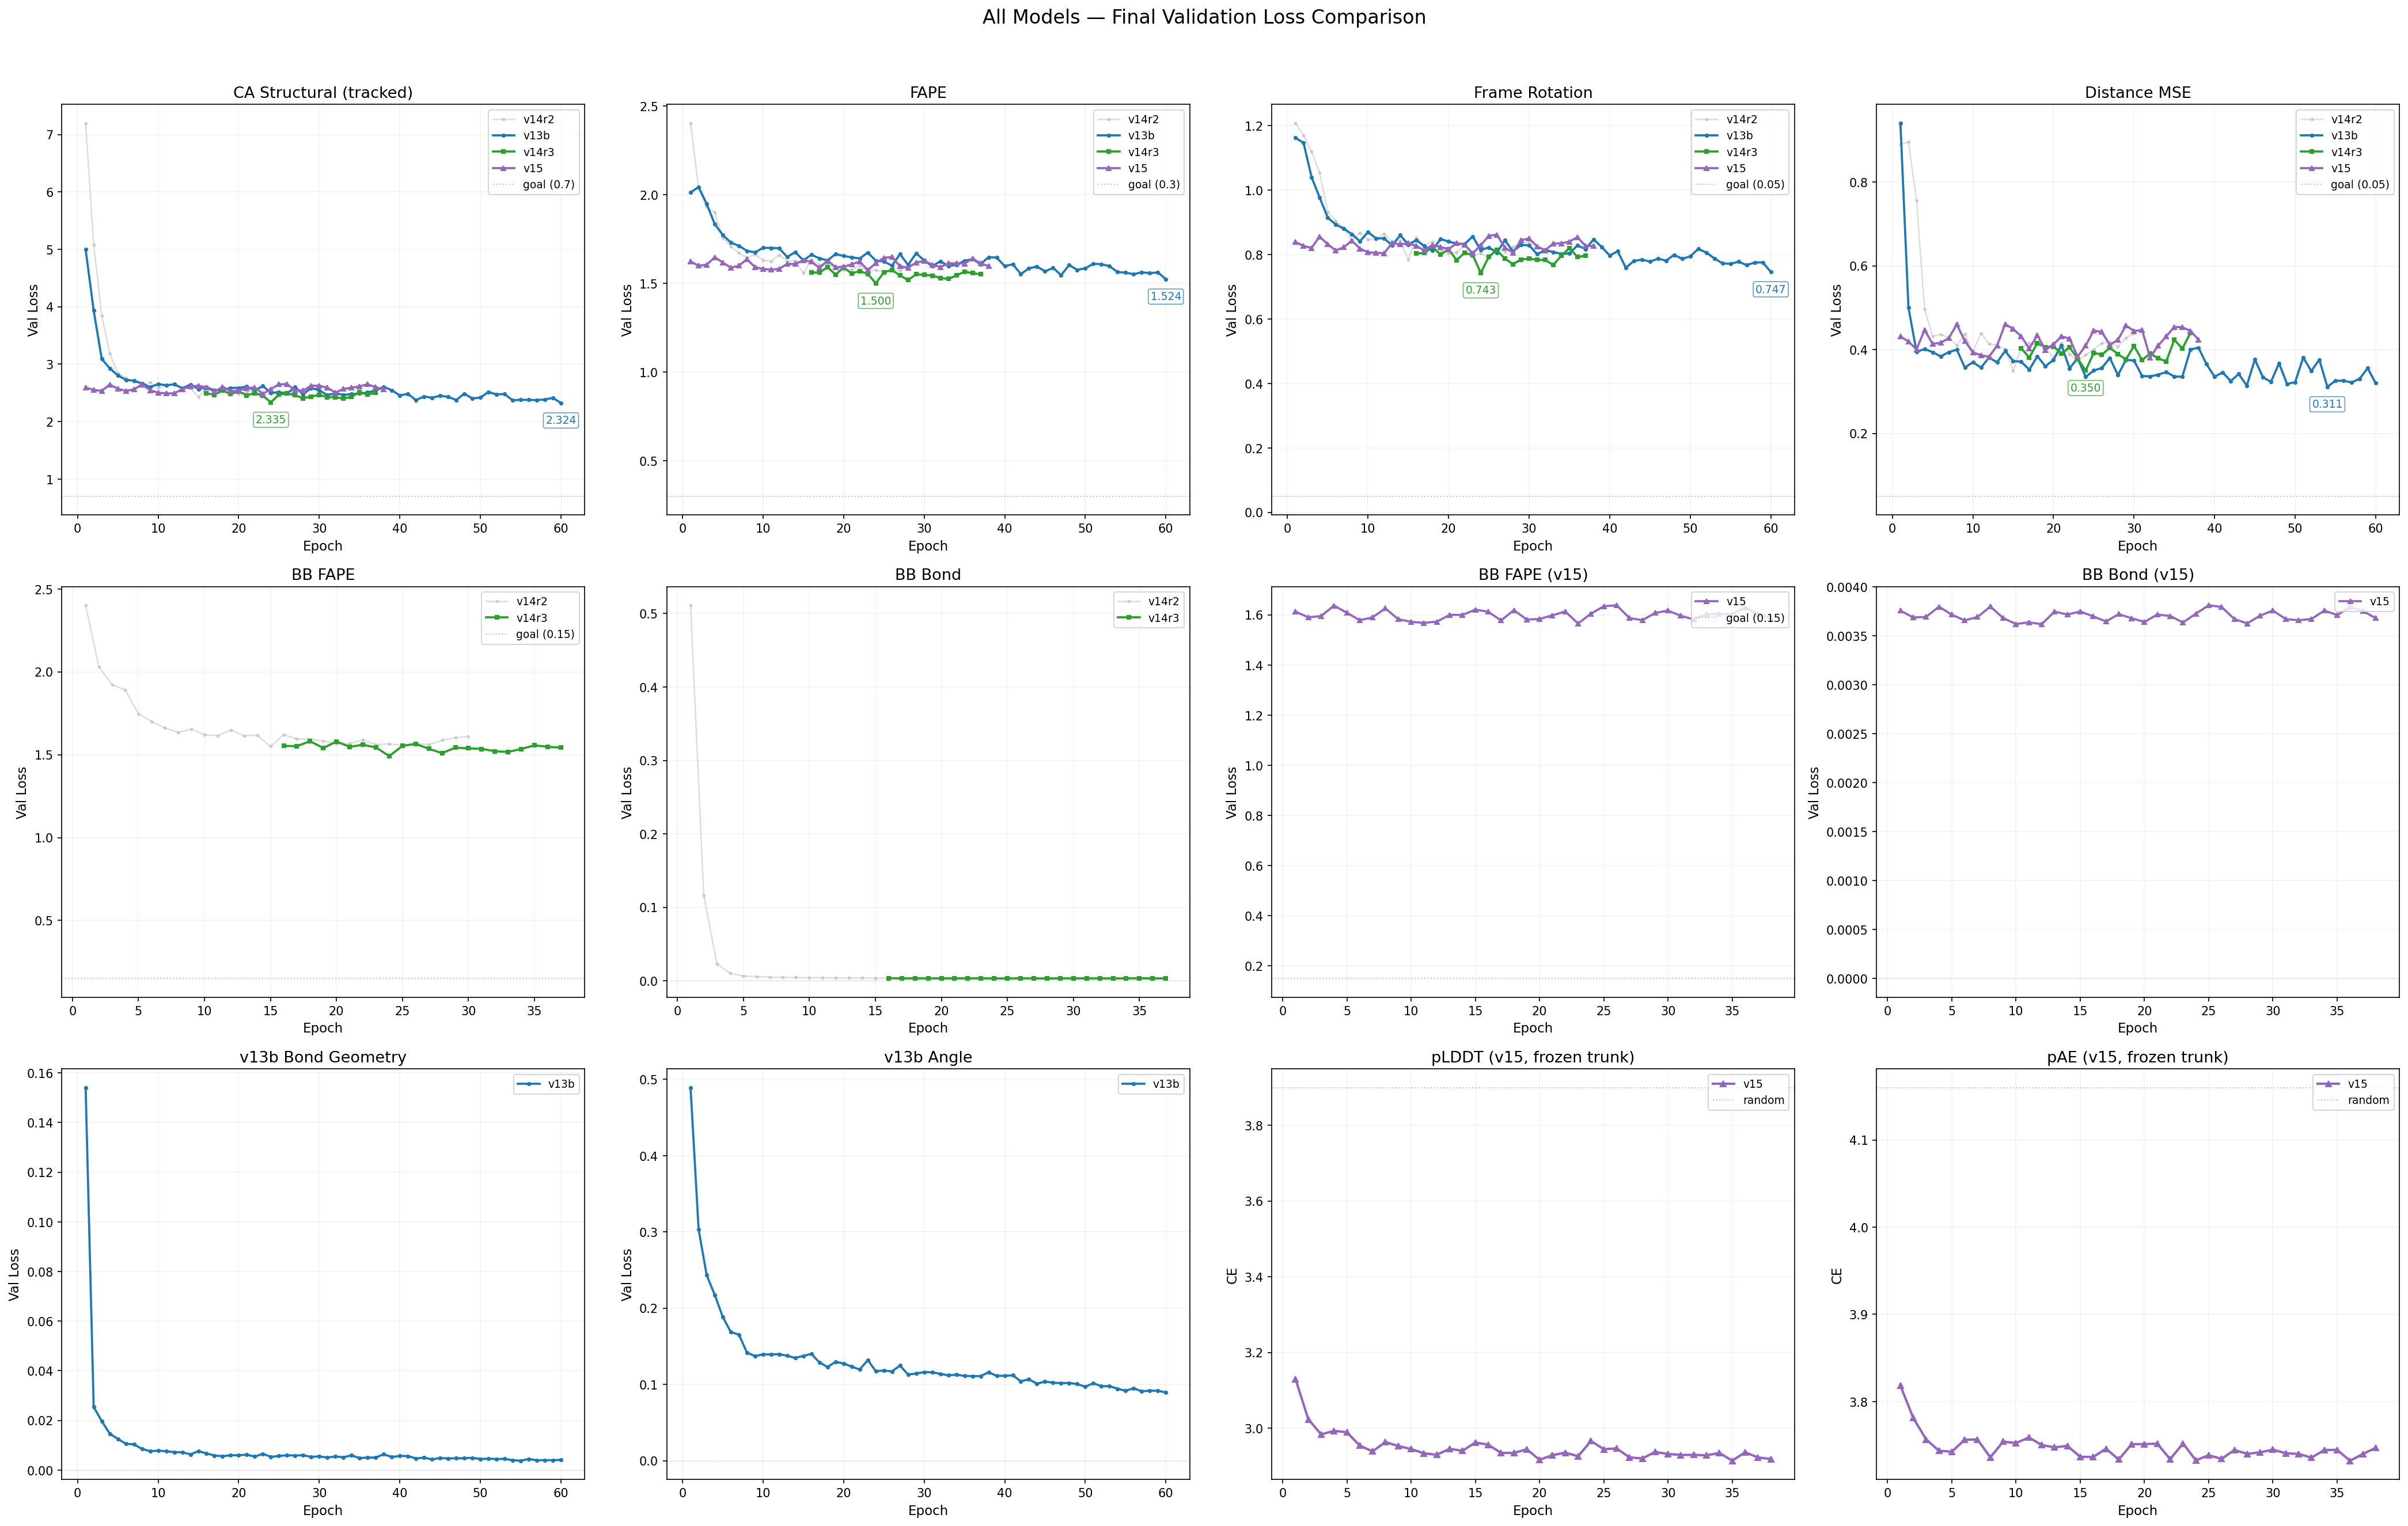
• v13b (blue) • v14 run2 (gray, stopped) • v14 run3 (green) • v15 (purple, when available) Dotted line = theoretical floor.
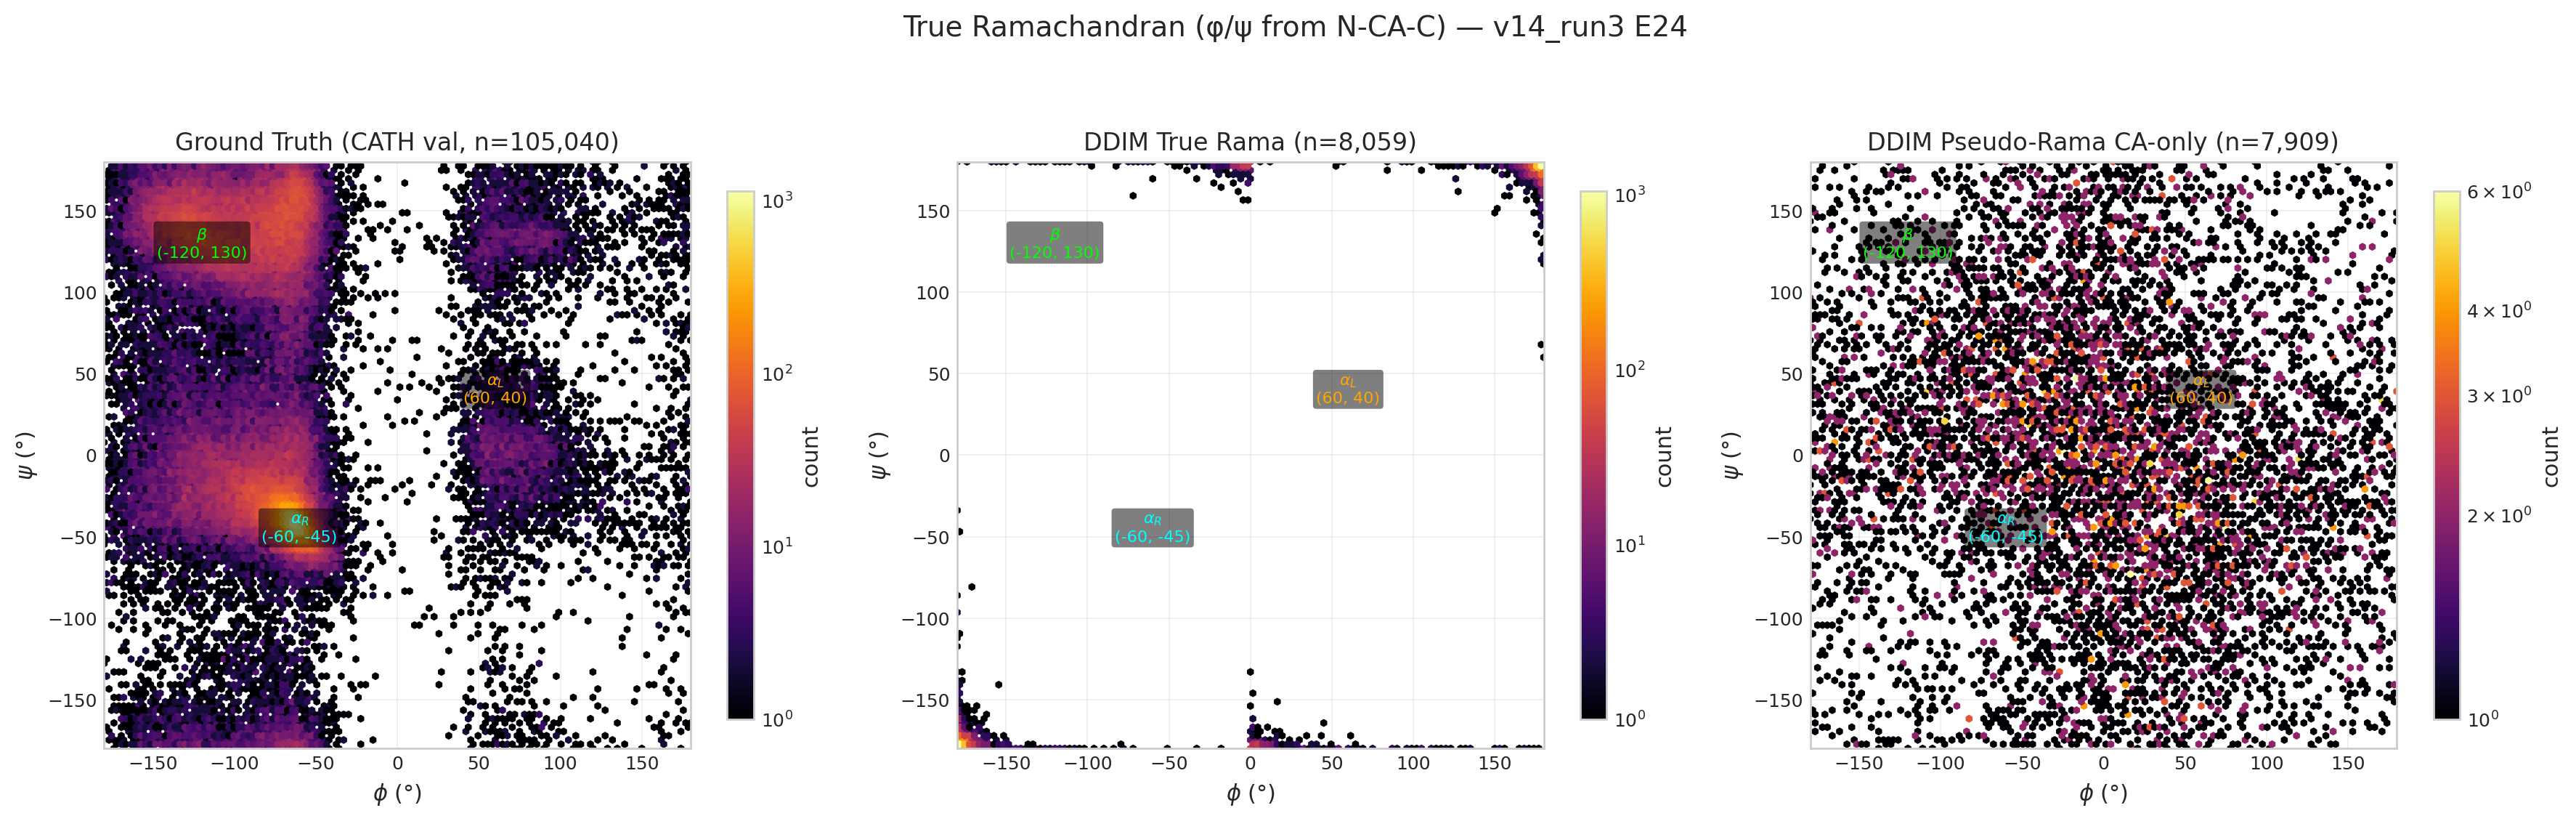
Ramachandran Plots (latest per model)
v13b E40 pseudo-Ramachandran (structural 2.456)
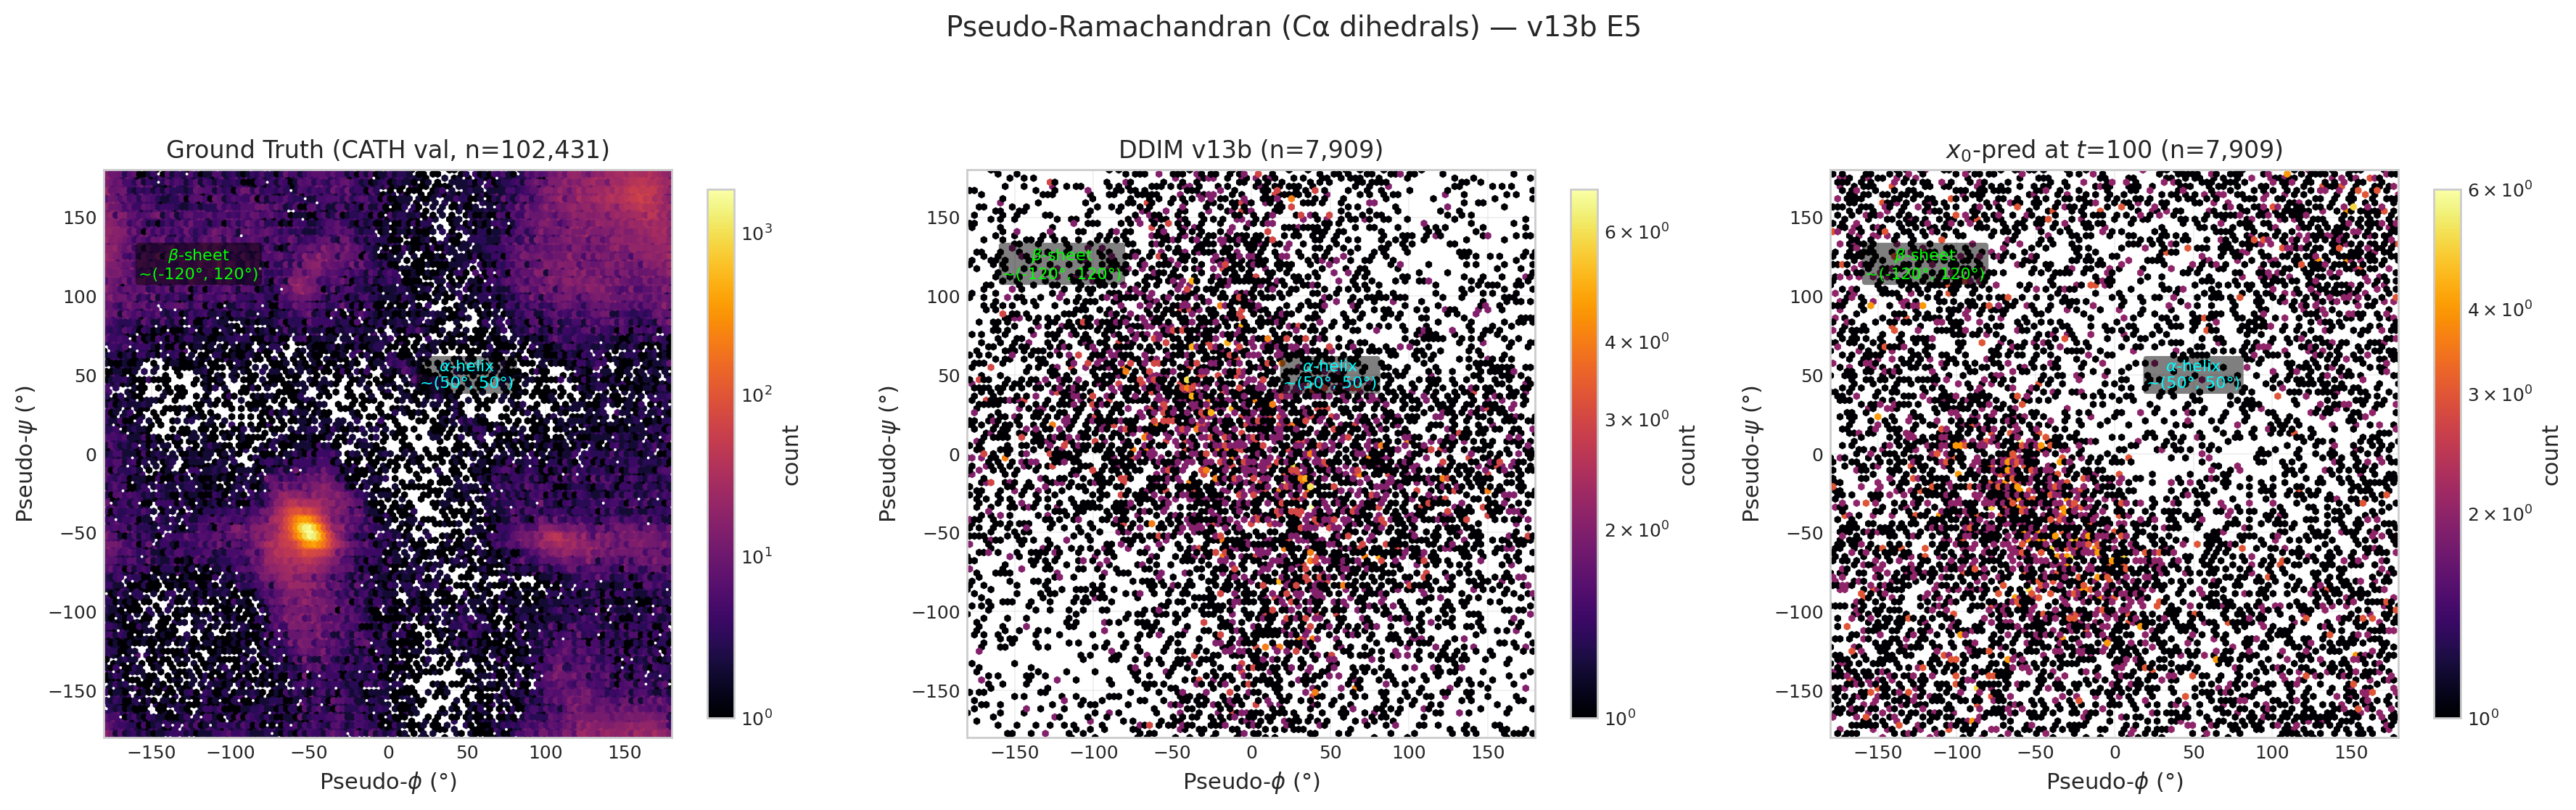
v14 run3 E24 true Ramachandran (structural 2.335)
v13 (original) — superseded by v13b
Early stopped at E19 (pat 15/15, best E4 structural 2.373). Two bugs: CLIP_PAIR_STACK=0.5 strangled
pair stack learning, dist_head frozen at random init. Full table in
Archive tab.
Side Chain Prediction (Future)
Side Chain Reconstruction
PlannedPlanned Approach
- Chi angle prediction: Predict side chain dihedral angles (χ1–χ4) conditioned on backbone frames, residue type, and pair representation.
- Hierarchical placement: Backbone atoms are placed first (from v14 frames), then side chain atoms are built outward using predicted chi angles and ideal bond geometry.
- Rotamer-aware loss: Side chain loss will account for rotamer distributions — penalizing chi angles that fall outside known rotamer basins for each residue type.
- Clash penalty: Steric clash loss between predicted side chain atoms to enforce physically valid packing.
Prerequisites
This module depends on v14’s full backbone prediction being stable and well-converged first. Accurate backbone frames are essential — side chain atoms are placed relative to the backbone frame, so errors in backbone geometry propagate directly to side chain positions. Work will begin once v14 demonstrates consistent bond/angle geometry and competitive FAPE scores.
FrameDiff v2 Archive Archived — superseded by v3
FrameDiff v2: IGSO3 Backbone Diffusion (14.4M params, 111 epochs) — click to expand
FrameDiff v2: IGSO3 Backbone Diffusion
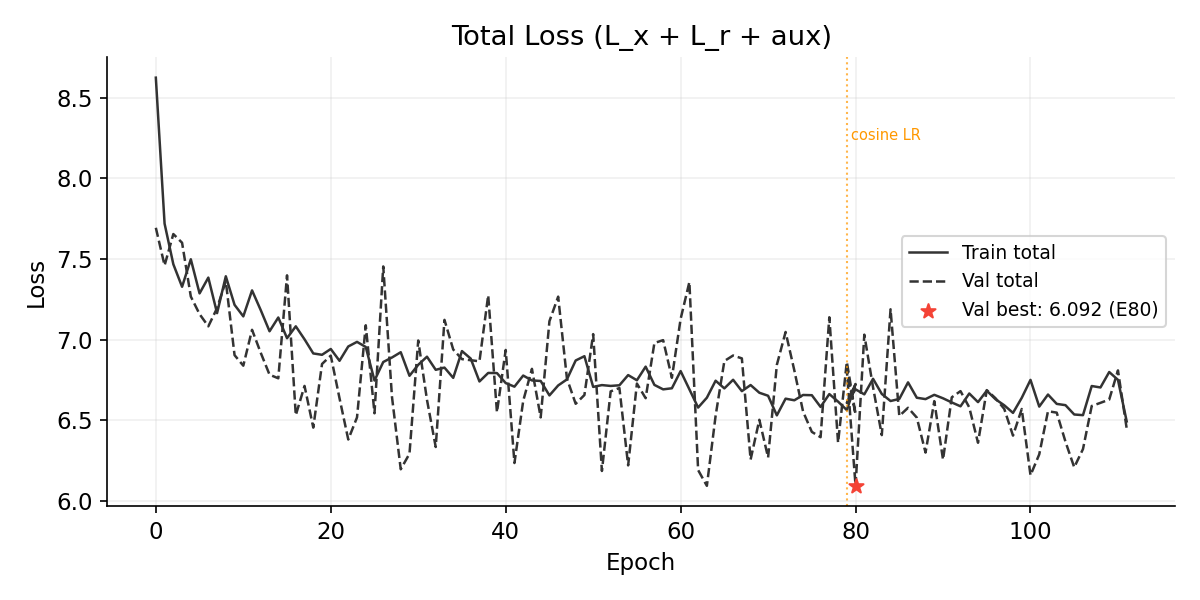
Unconditional protein backbone generation via SE(3) diffusion with proper IGSO3 rotation noise and score matching loss. 14.4M params, 8 layers, 2×A40. Cosine LR schedule. Training on CATH 4.3 (10,600 chains). [Full Report PDF — 69 pages with source code]
Current Model
- 14.4M params · 8× IPA (12 heads) + Transformer + 2-layer MLP backbone updates
- IGSO3 rotation noise (σmin=0.1, σmax=1.5) + IGSO3 score matching loss
- VP-SDE translation diffusion + geodesic reverse SDE for sampling
- Cosine LR decay (1e-4 → 1e-6) — added after E81 explosion with constant LR
- Self-conditioning (50%) + auxiliary losses (L_bb, L_2d at t<0.25)
- Stop-gradient on intermediate frames (numerical stability for 8 layers)
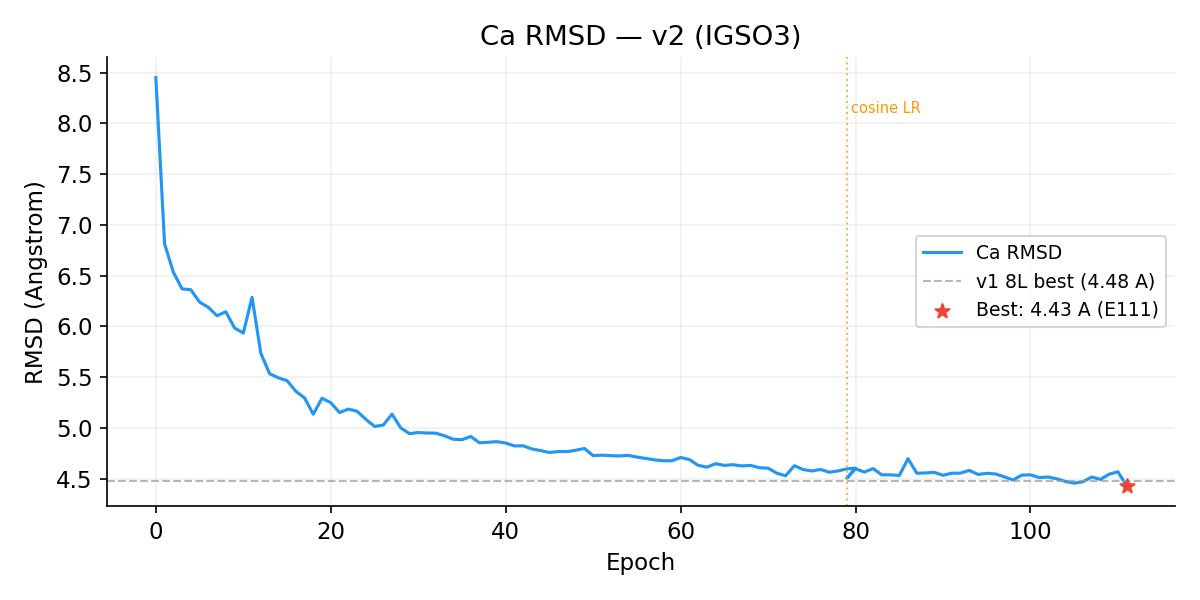
Structural Metrics
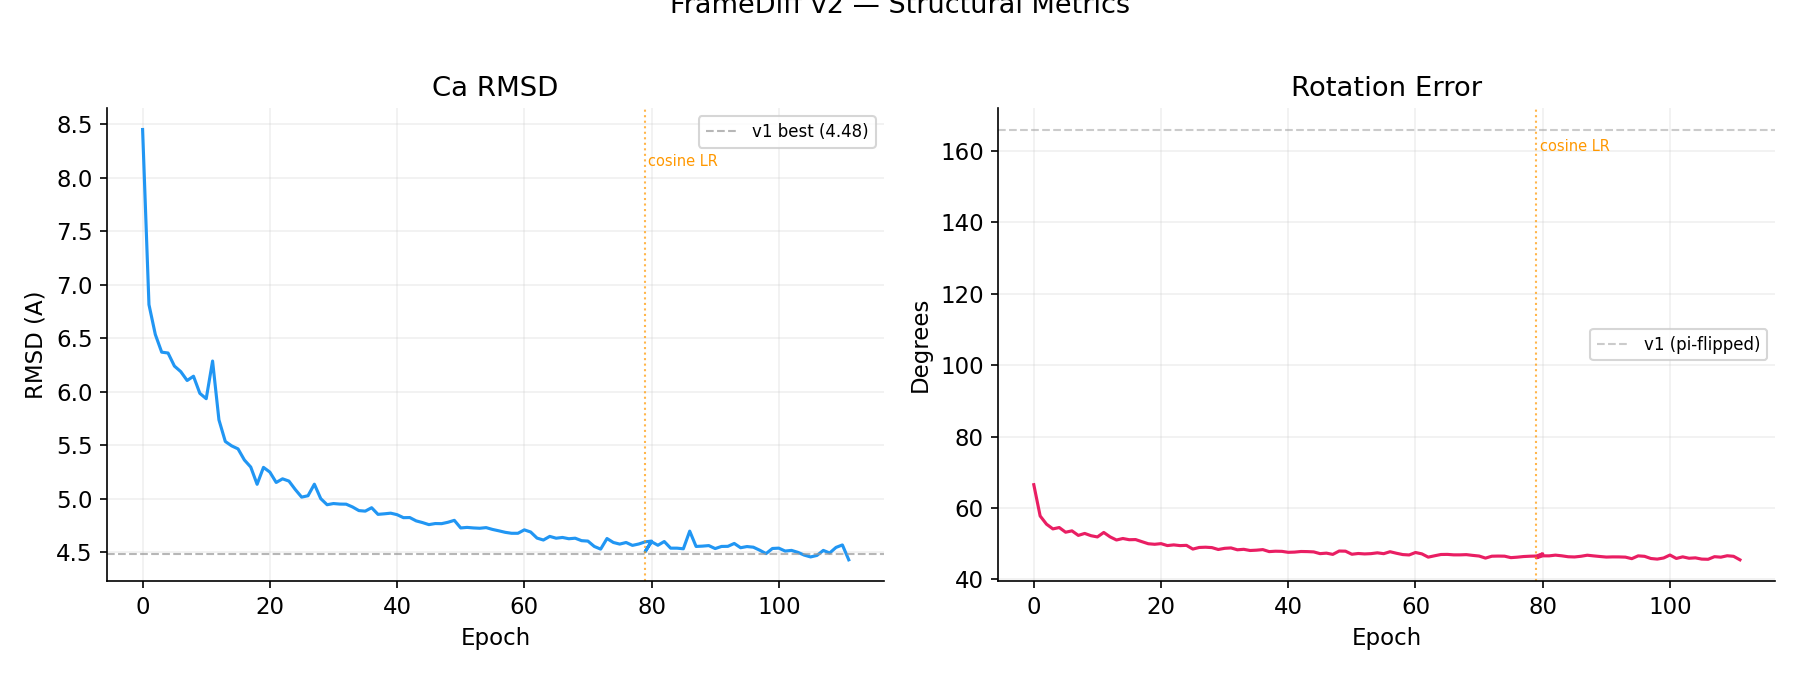
Ca RMSD: 8.45 → 4.50 A (v1 best: 4.48 A, dashed). Rotation error: 66.5 → 46.0 deg (v1 models: ~166 deg, mirror-flipped). Orange dotted line marks cosine LR restart at E79.
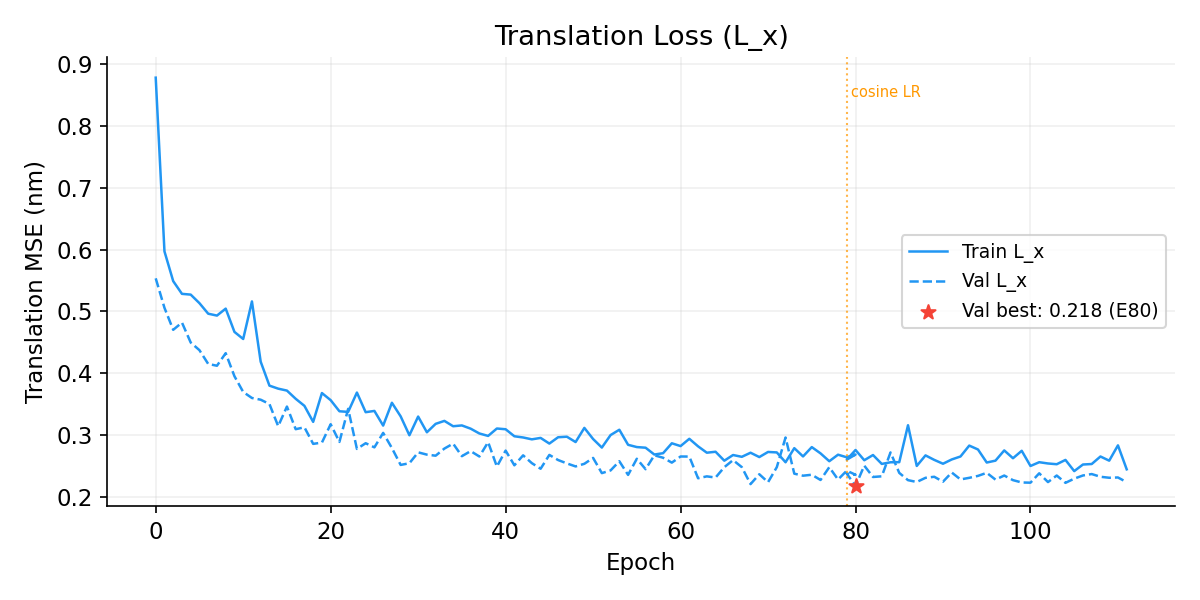
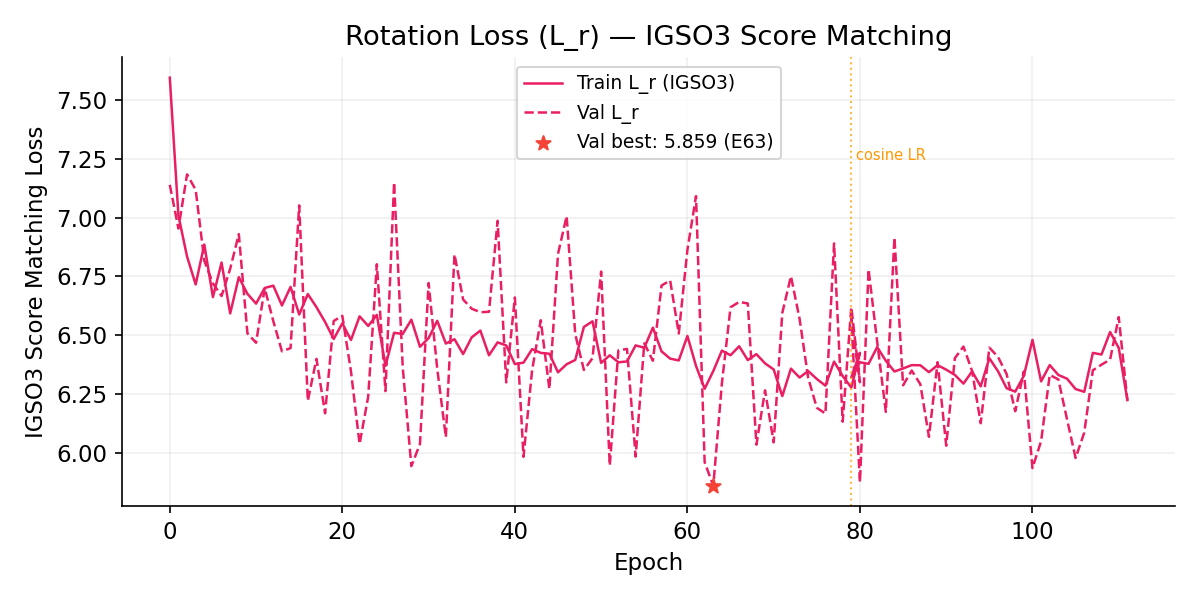
All Loss Components
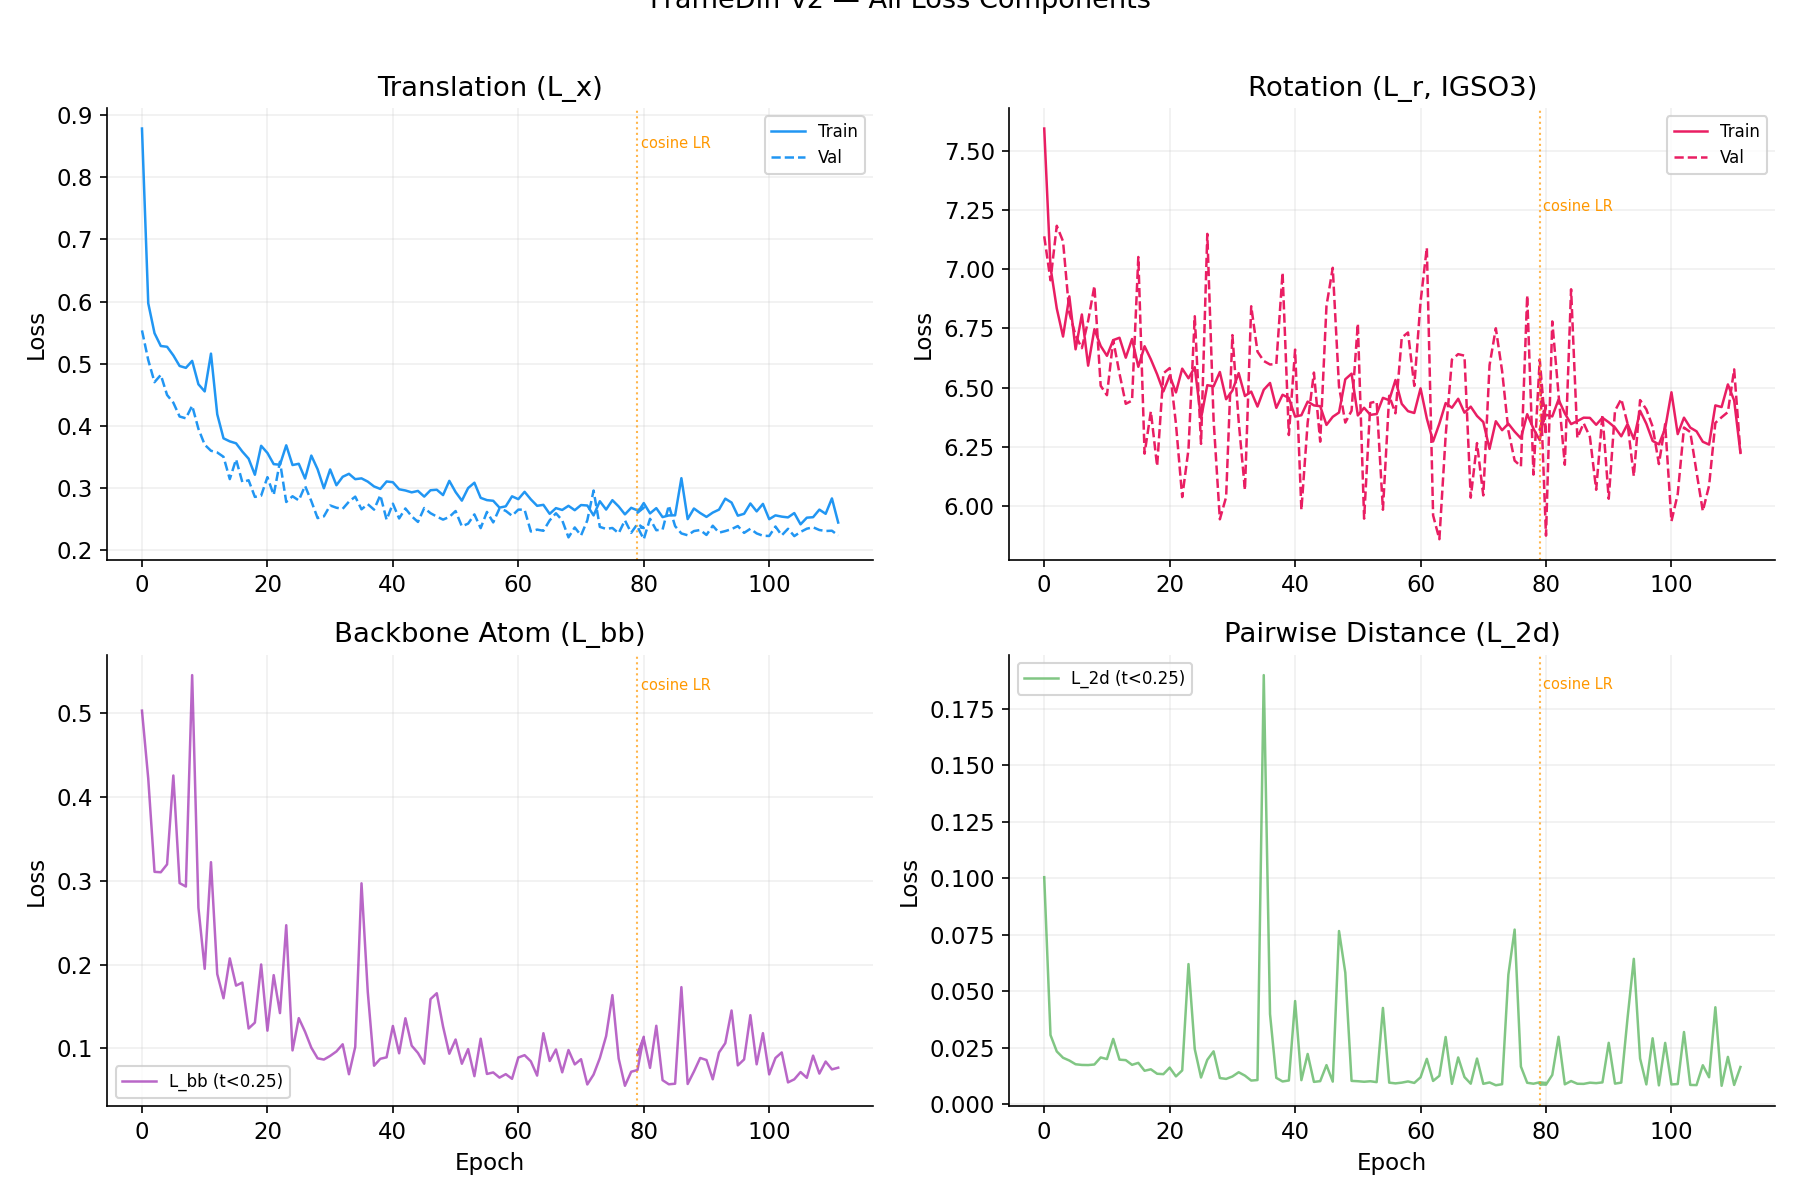
Top-left: Translation MSE (L_x). Top-right: IGSO3 rotation score matching (L_r). Bottom-left: Backbone atom loss (L_bb, t<0.25). Bottom-right: Pairwise Ca distance (L_2d).
Ca RMSD
Rotation Angle Error
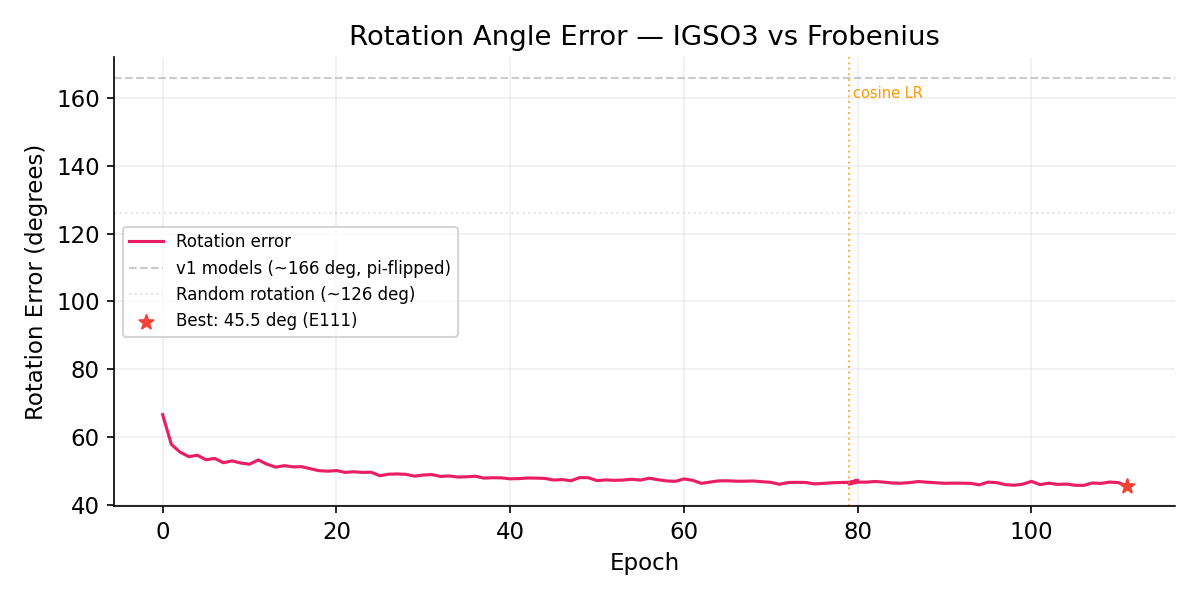
v2 rotation error monotonically decreases (66 → 46 deg) without the π-flip seen in v1 models. The IGSO3 score provides correct directional supervision. For reference: random rotation ~126 deg, v1 Frobenius ~166 deg (mirror-flipped).
Translation Loss (L_x)
Rotation Loss (L_r, IGSO3 Score Matching)
Learning Rate Schedule
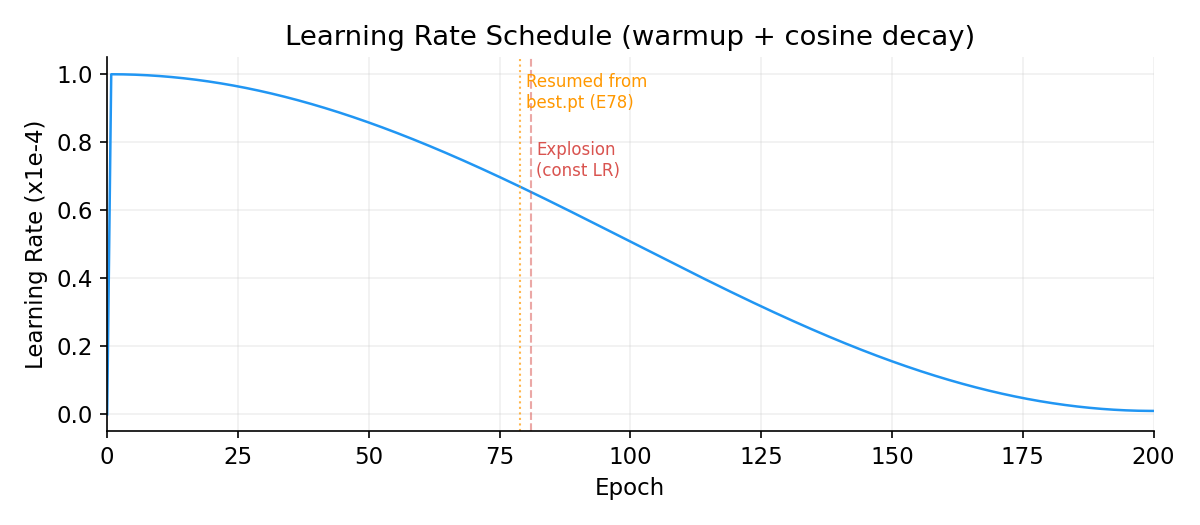
Constant LR caused catastrophic divergence at E81 (L_r jumped 6.4 → 612). Resumed from best checkpoint (E78) with cosine decay. E79+ trains stably past the explosion zone.
Total Loss
Training Progress
| Epoch | L_x | L_r (IGSO3) | Rot Err (deg) | RMSD (A) | Val Total | Notes |
|---|---|---|---|---|---|---|
| 0 | 0.879 | 7.60 | 66.5 | 8.45 | 7.69 | |
| 9 | 0.467 | 6.68 | 52.3 | 5.98 | 6.90 | RMSD < 6 A |
| 18 | 0.321 | 6.56 | 50.0 | 5.13 | 6.45 | 2×A40 starts |
| 28 | 0.330 | 6.57 | 48.9 | 5.00 | 6.19 | RMSD < 5 A |
| 40 | 0.309 | 6.38 | 47.6 | 4.85 | 6.94 | |
| 51 | 0.280 | 6.41 | 47.3 | 4.73 | 6.18 | |
| 63 | 0.271 | 6.35 | 46.6 | 4.61 | 6.09 | Best val (pre-explosion) |
| 71 | 0.272 | 6.24 | 46.0 | 4.55 | 6.84 | RMSD 4.55 |
| 81 | Explosion (L_r=612) — constant LR too aggressive. Resumed from E78 with cosine decay. | |||||
| 79* | 0.260 | 6.32 | 46.0 | 4.50 | 6.81 | Cosine LR, resumed from best.pt |
| 80* | 0.276 | 6.39 | 46.6 | 4.60 | 6.09 | val=6.09, stable |
| 83* | 0.253 | 6.39 | 46.6 | 4.54 | 6.41 | Stable through E81+ zone |
| 88* | 0.267 | 6.34 | 46.6 | 4.56 | 6.30 | |
| 91* | 0.260 | 6.33 | 46.3 | 4.55 | 6.64 | |
| 94* | 0.277 | 6.28 | 45.8 | 4.54 | 6.36 | |
| 97* | 0.275 | 6.27 | 45.9 | 4.52 | 6.57 | |
| 105* | 0.242 | 6.27 | 45.7 | 4.46 | 6.21 | RMSD 4.46, val=6.21 — BEAT v1 8L! |
| 108* | 0.265 | 6.42 | 46.2 | 4.49 | 6.61 | Early stop triggered (disabled) |
| 111* | 0.244 | 6.22 | 45.5 | 4.43 | 6.45 | ALL metrics new lows! |
Last updated: Mar 17, 2026. Training ongoing with cosine LR. * = post-restart epoch numbering.
Archived Models
Earlier model variants using Frobenius geodesic loss (not IGSO3). Both exploded around E78-81 due to constant LR.
4-Layer v1 (6.4M params) — best RMSD 4.26 A, exploded E78
Frobenius geodesic rotation loss. Best val=0.298 (E43). Rotation error ~166 deg (pi-flipped). Diverged catastrophically at E78 (L_x=34).
8-Layer v1 (12.8M params) — best RMSD 4.48 A, stopped E36
Frobenius geodesic rotation loss with stop-gradient. Best val=0.327 (E33). Rotation error ~166 deg (pi-flipped). Hit 6h wall clock at E36.
v13 Training Archive Archived — superseded by v13b
v13 early stopped at E19 (patience 15/15, best E4). Two critical bugs prevented further improvement:
CLIP_PAIR_STACK=0.5 strangled pair stack learning, and dist_head was missing from the optimizer.
Superseded by v13b which fixes both bugs and trains from scratch.
| Epoch | Val Total | FAPE | Frame Rot | Dist MSE | Bond | Aux Dist | Chirality | Angle | Rg | DDIM TM | Status |
|---|---|---|---|---|---|---|---|---|---|---|---|
| 1 | 2.571 | 1.657 | 0.846 | 0.353 | 0.009 | 0.323 | 0.347 | 0.130 | 0.036 | 0.114 | NEW BEST |
| 2 | 2.494 | 1.610 | 0.792 | 0.359 | 0.007 | 0.324 | 0.336 | 0.115 | 0.036 | — | NEW BEST |
| 3 | 2.533 | 1.611 | 0.829 | 0.374 | 0.008 | 0.324 | 0.336 | 0.120 | 0.036 | — | pat 1 |
| 4 | 2.373 | 1.546 | 0.771 | 0.312 | 0.008 | 0.323 | 0.319 | 0.113 | 0.036 | — | NEW BEST |
| 5–18 | No improvement (patience 1–14). Pair stack strangled by CLIP_PS=0.5, dist_head frozen. | pat 1–14 | |||||||||
| 19 | 2.425 | 1.553 | 0.791 | 0.346 | 0.005 | 0.399 | 0.343 | 0.102 | 0.035 | — | EARLY STOP |
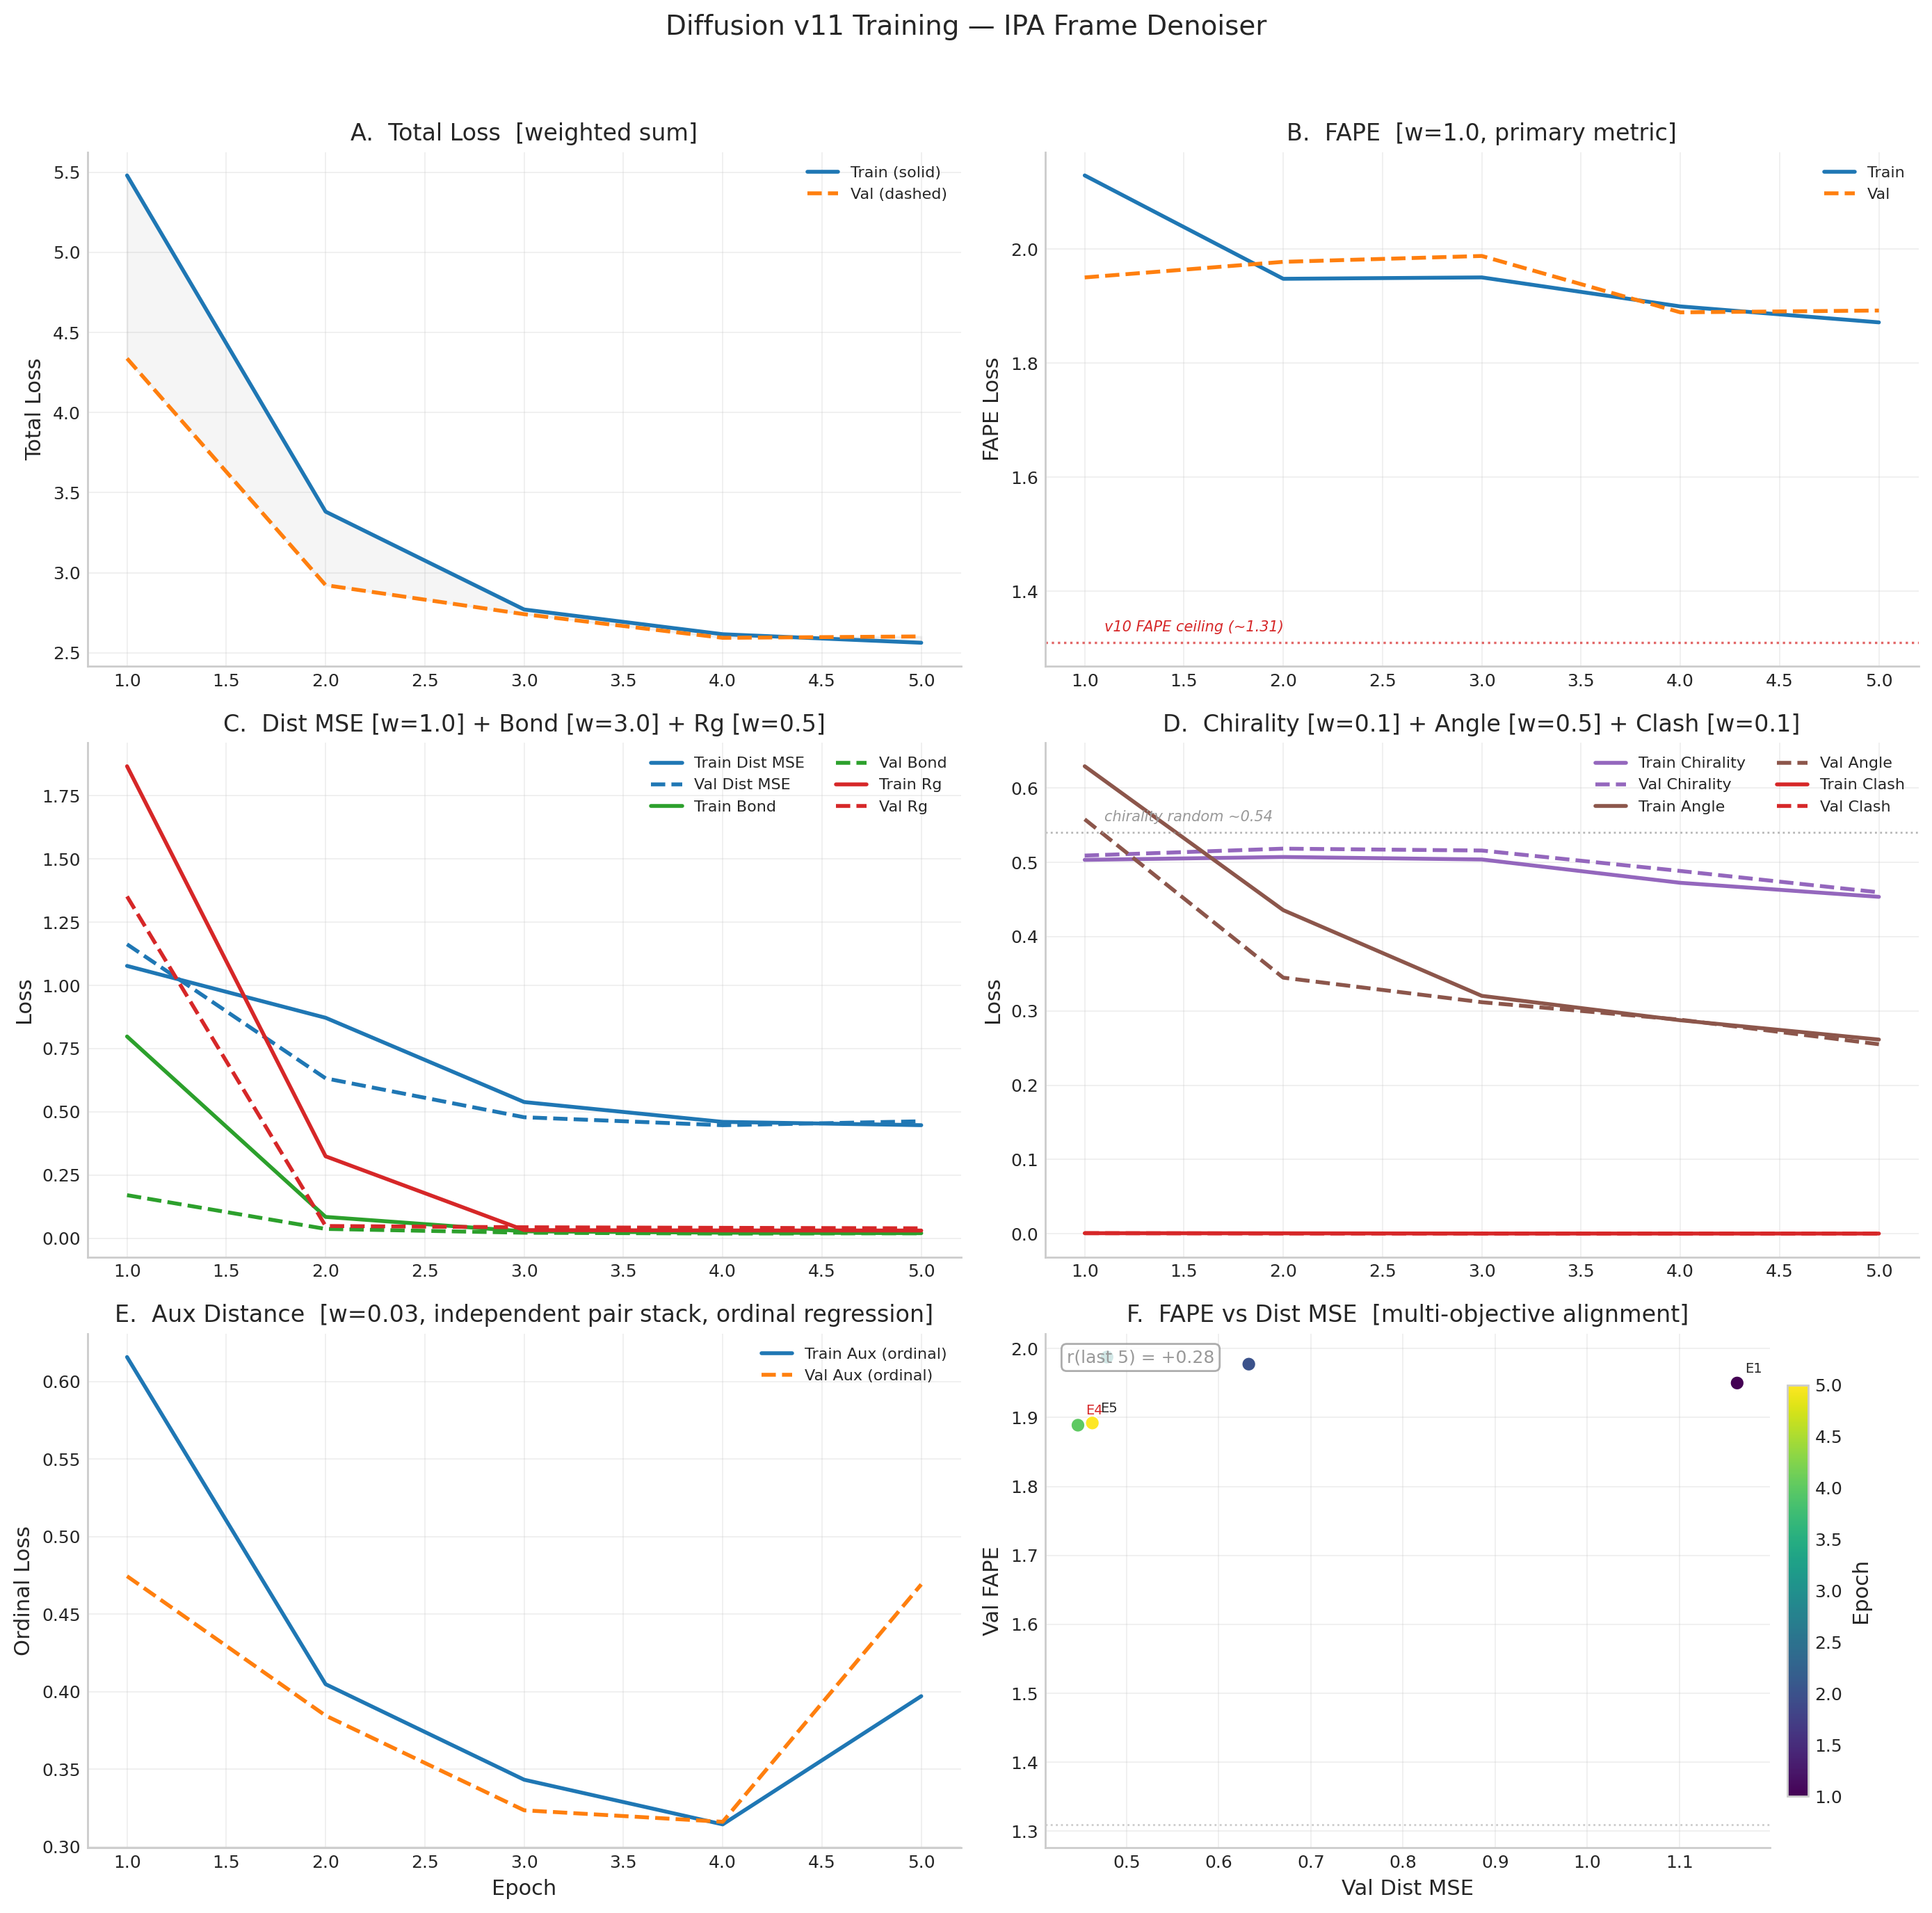
v13 Loss Curves (with v12/v12b overlay)
v12b Training Archive Archived — superseded by v13
Protein Backbone Diffusion Model v12b
CompleteWhy IPA? The v10 Ceiling
v10 used an 8-layer EGNN denoiser that learned pairwise distance statistics well (dist_mse 60% below random) but could not learn protein topology. FAPE stayed at its random baseline (~1.31) across 21 epochs and TM-score peaked at 0.131 (random ~0.10). EGNN has no concept of local reference frames — it reasons about distances, not backbone geometry. IPA solves this by maintaining and refining per-residue rigid-body frames (rotation + translation) through 3D point attention in local coordinate systems.
v11b Key Changes (from v11)
- Frame rotation loss (w=0.5) — direct angular distance:
1 - cos(angle)between learned R and Gram-Schmidt ground truth. Gives rotation quaternions direct gradient for the first time. - FAPE with learned frames —
fape_loss_with_framesuses R_pred from IPA layers instead of rebuilding from coordinates. The R → FAPE gradient path is now intact. - LR halved — 2e-5 (from 5e-5) to prevent overshooting now that rotations receive gradient
- Self-conditioning reduced — SC probability 0.25 (from 0.5) to let the model learn from scratch more
- Initialized from v11 E10 best — EMA weights only, fresh optimizer + scheduler
v12b Training Fixes (over v12)
- Per-module gradient clipping: denoiser max_norm=1.0, pair_stack=0.5, aux_pair=0.5
- Per-module LR groups: pair_stack gets 3x base LR (6e-5) to compensate gradient attenuation
- Pair stack tripwire: if grad norm < 0.01 for 50 consecutive steps, inject gradient noise (scale=0.01)
- Hard halt: if grad norm < 0.001 for 500 total steps, stop training
- Atomic checkpoint saves: write to tmp file then rename to survive SLURM preemption
- NaN loss batches: skipped entirely instead of poisoning gradient accumulator
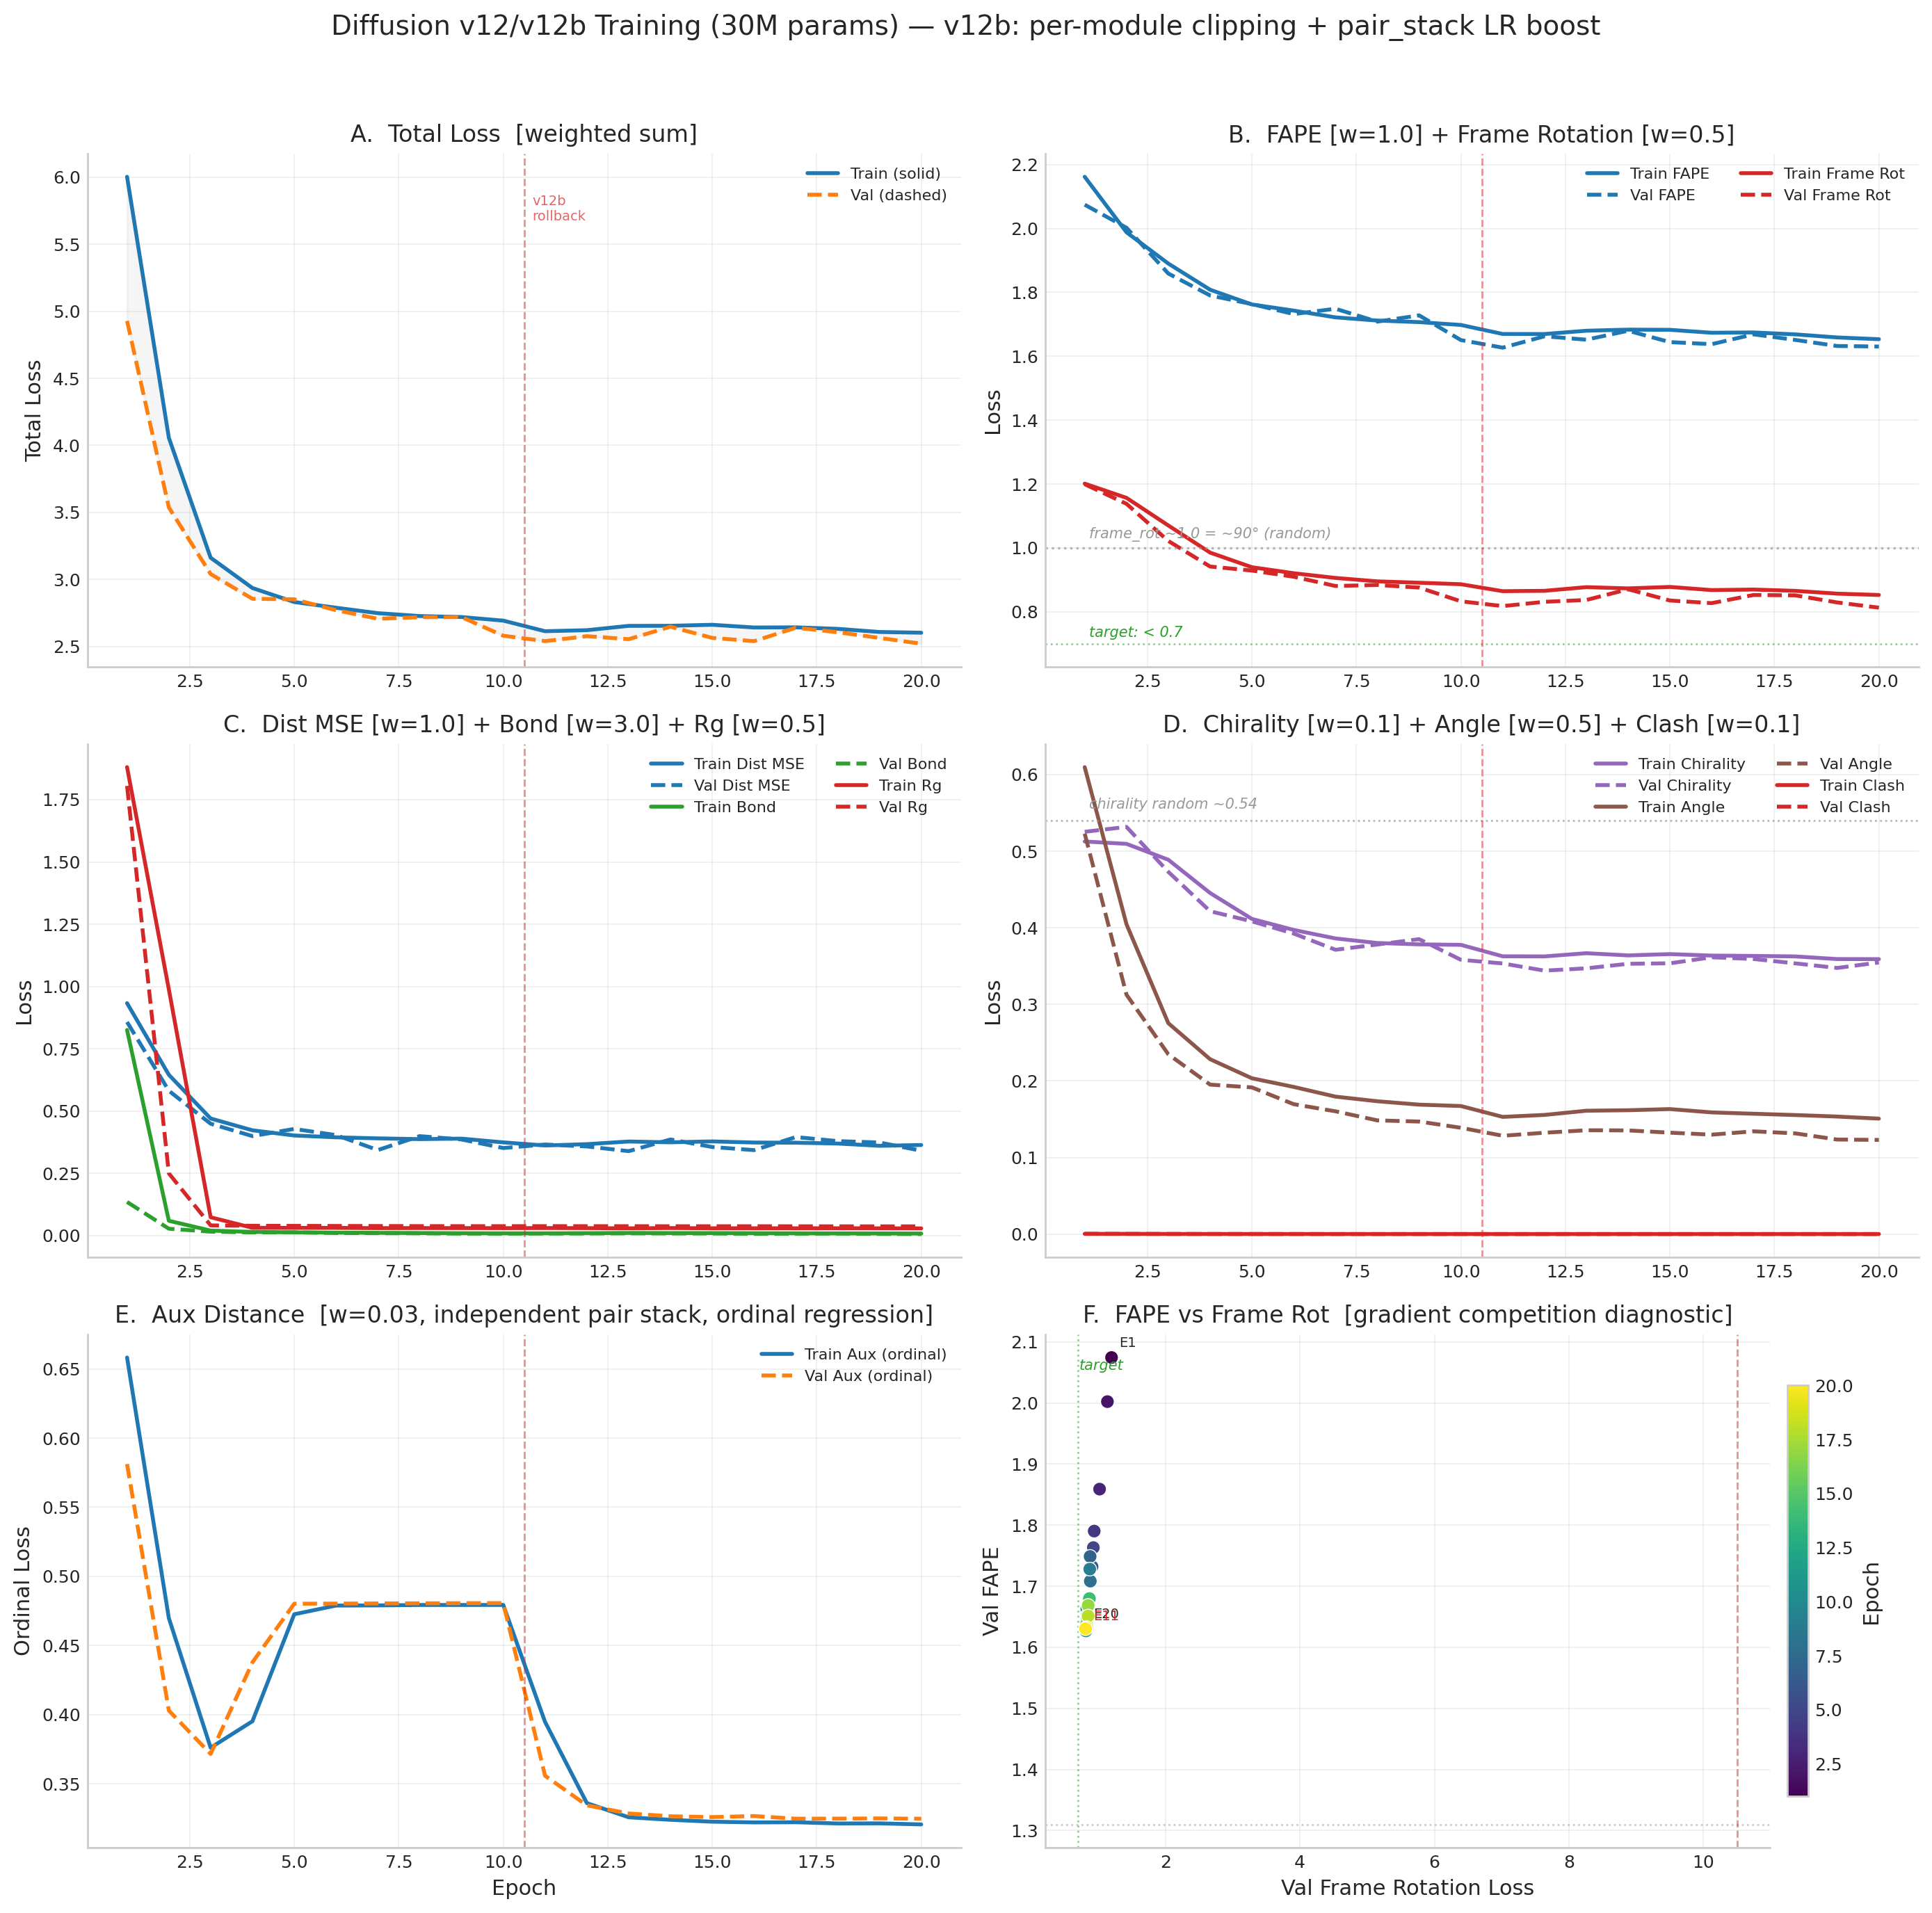
v12b Loss Weights
| Loss | v11 | v11b/v12b | Rationale |
|---|---|---|---|
| FAPE (w/ learned R) | 1.0 | 1.0 | v11b uses learned R_pred instead of Gram-Schmidt rebuilt frames |
| Frame Rot | — | 0.5 | NEW: direct angular loss on learned R vs ground truth. The v11b fix. |
| Bond | 3.0 | 3.0 | — |
| Clash | 0.1 | 0.1 | — |
| Aux dist | 0.03 | 0.03 | — |
| Dist MSE | 1.0 | 1.0 | — |
| Chirality | 0.1 | 0.1 | — |
| Angle | 0.5 | 0.5 | — |
| Rg | 0.5 | 0.5 | — |
v12/v12b Loss Curves
Pseudo-Ramachandran Analysis
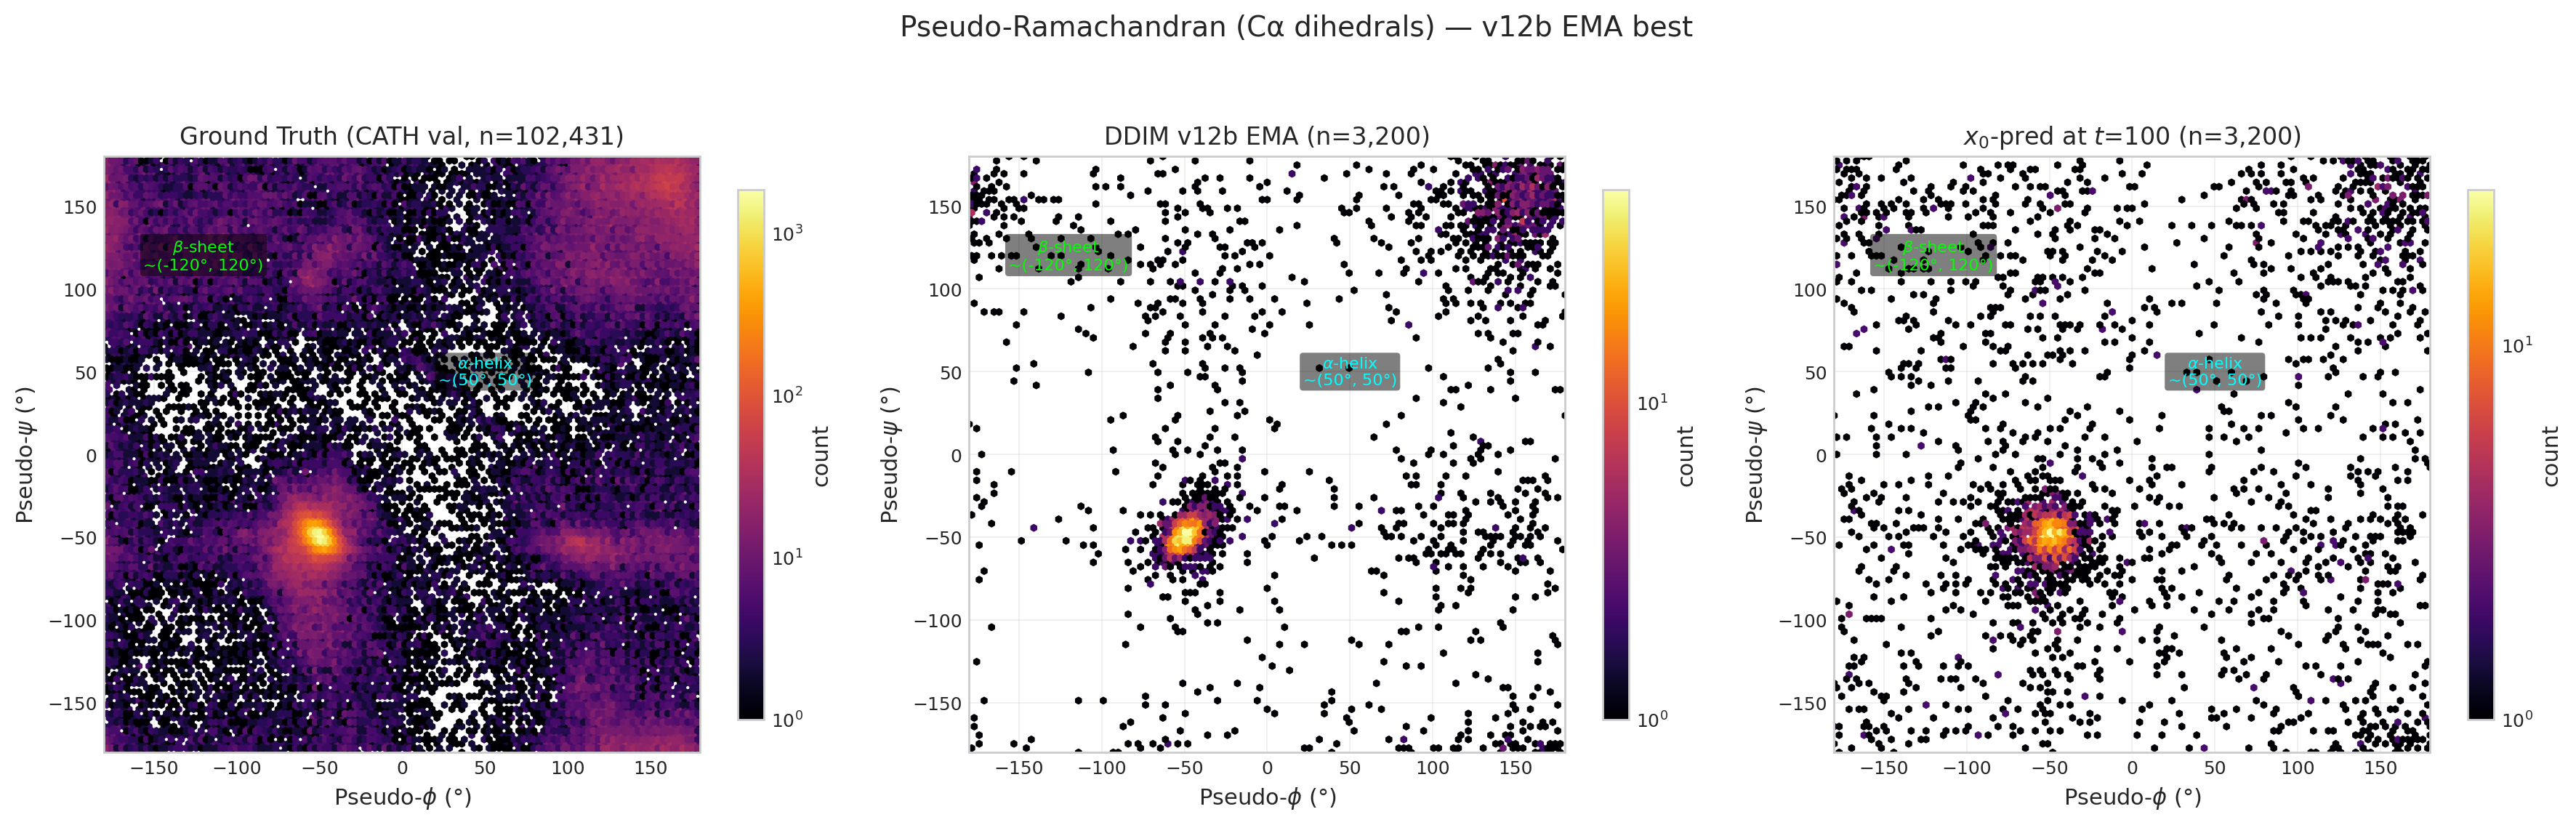
Pseudo-dihedrals computed from consecutive Cα positions. Ground truth (left) shows clear α-helix (~50°,50°) and β-sheet (~−120°,120°) clusters.
v12/v12b Full Training Table
| Epoch | Val Total | Val FAPE | Val Frame Rot | Val Dist | Val Bond | DDIM TM | DDIM RMSD | Status |
|---|---|---|---|---|---|---|---|---|
| 1 | 4.928 | 2.074 | 1.199 | 0.857 | 0.135 | 0.101 | 15.28Å | NEW BEST |
| 2 | 3.538 | 2.002 | 1.138 | 0.581 | 0.028 | 0.132 | 13.73Å | NEW BEST |
| 3 | 3.041 | 1.859 | 1.022 | 0.449 | 0.016 | 0.118 | 15.33Å | NEW BEST |
| 4 | 2.856 | 1.790 | 0.942 | 0.399 | 0.013 | 0.103 | 16.56Å | NEW BEST |
| 5 | 2.852 | 1.763 | 0.929 | 0.428 | 0.013 | 0.101 | 16.88Å | NEW BEST |
| 6 | 2.771 | 1.732 | 0.910 | 0.403 | 0.010 | 0.102 | 16.99Å | NEW BEST |
| 7 | 2.707 | 1.749 | 0.881 | 0.343 | 0.010 | 0.099 | 17.26Å | NEW BEST |
| 8 | 2.719 | 1.708 | 0.884 | 0.399 | 0.009 | 0.099 | 17.23Å | pat 1 |
| 9 | 2.720 | 1.728 | 0.876 | 0.386 | 0.008 | 0.101 | 17.04Å | pat 2 |
| 10 | 2.581 | 1.651 | 0.833 | 0.352 | 0.008 | 0.102 | 17.09Å | NEW BEST |
| 11 | 2.685 | 1.684 | 0.864 | 0.391 | 0.009 | 0.098 | 17.41Å | pat 1 |
| 12 | 2.831 | 1.804 | 0.905 | 0.391 | 0.009 | 0.087 | 18.46Å | pat 2 |
| 13 | 2.822 | 1.814 | 0.913 | 0.370 | 0.009 | 0.078 | 19.54Å | pat 3 |
| — v12b rollback to E10 EMA — per-module grad clipping, pair_stack 3x LR, tripwire | ||||||||
| b1 | 2.541 | 1.627 | 0.818 | 0.366 | 0.008 | 0.102 | 16.98Å | NEW BEST |
| b2 | 2.577 | 1.662 | 0.831 | 0.358 | 0.008 | 0.105 | 16.89Å | pat 1 |
| b3 | 2.555 | 1.652 | 0.837 | 0.339 | 0.009 | 0.103 | 17.09Å | pat 2 |
| b4 | 2.648 | 1.680 | 0.870 | 0.386 | 0.009 | 0.107 | 16.88Å | pat 3 |
| b5 | 2.565 | 1.644 | 0.835 | 0.356 | 0.008 | 0.104 | 17.02Å | pat 4 |
| b6 | 2.540 | 1.638 | 0.827 | 0.343 | 0.007 | 0.108 | 16.80Å | pat 5 |
| b7 | 2.641 | 1.668 | 0.852 | 0.396 | 0.008 | 0.113 | 16.47Å | pat 6 |
| b8 | 2.607 | 1.651 | 0.851 | 0.379 | 0.008 | 0.113 | 16.39Å | pat 7 |
| b9 | 2.564 | 1.632 | 0.829 | 0.374 | 0.007 | 0.112 | 16.40Å | pat 8 |
| b10 | 2.521 | 1.630 | 0.813 | 0.341 | 0.006 | 0.113 | 16.42Å | NEW BEST |
| b11 | 2.553 | 1.633 | 0.829 | 0.362 | 0.006 | 0.110 | 16.52Å | pat 1 |
| b12 | 2.558 | 1.628 | 0.835 | 0.370 | 0.007 | 0.111 | 16.56Å | pat 2 |
| b13 | 2.534 | 1.635 | 0.826 | 0.343 | 0.007 | 0.110 | 16.64Å | pat 3 |
| b14 | 2.500 | 1.606 | 0.814 | 0.349 | 0.006 | 0.107 | 17.13Å | NEW BEST |
| b15 | 2.480 | 1.586 | 0.807 | 0.391 | 0.006 | 0.112 | 16.62Å | NEW BEST |
| b16 | 2.469 | 1.564 | 0.780 | 0.347 | 0.006 | 0.112 | 16.62Å | NEW BEST |
| b17 | 2.506 | 1.608 | 0.815 | 0.355 | 0.006 | 0.110 | 16.88Å | pat 1 |
| b18 | 2.497 | 1.626 | 0.809 | 0.335 | 0.005 | 0.108 | 16.83Å | pat 2 |
| b19 | 2.517 | 1.607 | 0.820 | 0.365 | 0.006 | 0.110 | 16.92Å | pat 3 |
| b20 | 2.446 | 1.578 | 0.802 | 0.334 | 0.005 | 0.103 | 17.53Å | NEW BEST |
| b21 | 2.482 | 1.589 | 0.797 | 0.362 | 0.006 | 0.104 | 17.54Å | pat 1 |
| b22 | 2.488 | 1.607 | 0.801 | 0.347 | 0.005 | 0.107 | 17.42Å | pat 2 |
| b23 | 2.609 | 1.641 | 0.842 | 0.408 | 0.006 | 0.106 | 17.61Å | pat 3 |
| b24 | 2.450 | 1.589 | 0.799 | 0.329 | 0.006 | 0.102 | 17.80Å | pat 4 |
| b25 | 2.456 | 1.604 | 0.807 | 0.320 | 0.005 | 0.101 | 18.02Å | pat 5 |
| b26 | 2.460 | 1.597 | 0.796 | 0.335 | 0.005 | 0.101 | 18.02Å | pat 6 |
| b27 | 2.548 | 1.635 | 0.839 | 0.364 | 0.005 | 0.105 | 17.69Å | pat 7 |
| b28 | 2.501 | 1.626 | 0.813 | 0.342 | 0.005 | 0.107 | 17.53Å | pat 8 |
| b29 | 2.443 | 1.578 | 0.791 | 0.340 | 0.005 | 0.110 | 17.02Å | NEW BEST |
| b30 | 2.413 | 1.584 | 0.790 | 0.312 | 0.005 | 0.107 | 17.38Å | NEW BEST |
| b31 | 2.462 | 1.587 | 0.808 | 0.342 | 0.005 | 0.108 | 17.43Å | pat 1 |
Gradient cosine similarity diagnostic (E10 vs E12 vs E13)
Per-loss gradient directions on shared parameters (denoiser + pair_stack). Negative cosine = direct competition. Positive = aligned.
| Loss Pair | E10 (best) | E12 | E13 | Verdict |
|---|---|---|---|---|
| FAPE vs frame_rot | +0.59 | +0.57 | +0.50 | Aligned |
| dist_mse vs FAPE | +0.16 | +0.14 | +0.41 | Near-orthogonal |
| dist_mse vs frame_rot | +0.24 | +0.00 | -0.02 | Near-orthogonal |
| FAPE vs bond_geom | -0.04 | -0.23 | +0.02 | Near-orthogonal |
Key finding: No gradient competition between any loss pair. FAPE and frame_rot are strongly aligned (+0.5 to +0.6). The E11-E13 regression was caused entirely by gradient starvation of the pair_stack module — not conflicting loss objectives.
v11 post-mortem (different failure mode)
| Hypothesis | Result |
|---|---|
| Frame confidence starving updates | NO — 57.7% conf > 0.5 |
| Gradients dead at frame_update | NO — highest grad norm (4.017) |
| FAPE gradient reaches frame_update | YES — 13.03 (largest) |
| Learned R used in output | NO — R discarded |
Root cause (v11): x0_pred = t_vec discarded learned R. v11b fix: frame_rotation_loss + fape_loss_with_frames using learned R.
Loss Reference & Targets
| Metric | w | Type | v11b E1 | v11b E5 | v12 E1 | v12 E10 | Target / Interpretation |
|---|---|---|---|---|---|---|---|
| FAPE | 1.0 | L1 | 1.934 | 1.756 | 2.074 | 1.651 | Primary metric. Uses learned R_pred frames. v10 ceiling=1.31, untrained >2.0. <1.0 = correct folds. |
| Frame Rot | 0.5 | 1−cosθ | 1.067 | 0.888 | 1.199 | 0.833 | Angular error of learned R vs Gram-Schmidt truth. 1.0 = ~90° (random), 0 = perfect. Target: <0.5 by E15. |
| Dist MSE | 1.0 | MSE | 0.409 | 0.384 | 0.857 | 0.352 | Pairwise Cα distance error. <0.1 = sub-Å accuracy. Plateauing ~0.35–0.40. |
| Bond | 3.0* | MSE | 0.015 | 0.010 | 0.135 | 0.008 | Cα–Cα bond error. *annealed 1→3. Solved. |
| Rg | 0.5 | MSE | 0.038 | 0.038 | 1.805 | 0.038 | Radius of gyration error. Converged by E3. |
| TM-score | — | DDIM | 0.094 | 0.091 | 0.101 | 0.102 | 50-step DDIM. Target: >0.15 by E10, >0.30 by E20. >0.17 = recognizable folds. |
| RMSD | — | DDIM | 17.22Å | 17.62Å | 15.28Å | 17.09Å | <10Å = partial fold. <5Å = high quality. |
v11b Historical Results (14 epochs, gradient competition collapse at E8 — superseded by v12)
v11b validated the IPA + frame rotation loss design. Best epoch E8: FAPE 1.655, frame_rot 0.830, TM 0.093. After E8, gradient competition between dist_mse and frame_rot through shared 128-dim single representation caused collapse — TM dropped to 0.061, frame_rot reverted to 0.926. Stopped at E14.
| Epoch | Val Total | Val FAPE | Frame Rot | Val Dist | Val Bond | DDIM TM | Status |
|---|---|---|---|---|---|---|---|
| 1 | 3.057 | 1.934 | 1.067 | 0.409 | 0.015 | 0.094 | BEST |
| 5 | 2.736 | 1.756 | 0.888 | 0.384 | 0.010 | 0.091 | BEST |
| 8 | 2.580 | 1.655 | 0.830 | 0.351 | 0.009 | 0.093 | BEST (peak) |
| 11 | 2.797 | 1.813 | 0.880 | 0.374 | 0.008 | 0.079 | pat 3 |
| 14 | 2.973 | 1.898 | 0.926 | 0.423 | 0.011 | 0.061 | pat 6 (stopped) |
v11 Historical Results (15 epochs, no frame rotation supervision — superseded)
v11 used the same IPA architecture but had a critical bug: x0_pred = t_vec discarded
learned rotation matrices R. FAPE peaked at 1.818 (E10) then degraded to 2.052 (E15).
DDIM TM-score collapsed from 0.095 to 0.046.
| Epoch | Val Total | Val FAPE | Val Dist | Val Bond | DDIM TM | Status |
|---|---|---|---|---|---|---|
| 1 | 4.338 | 1.950 | 1.163 | 0.171 | 0.099 | BEST |
| 3 | 2.741 | 1.988 | 0.479 | 0.022 | 0.128 | BEST |
| 6 | 2.558 | 1.865 | 0.448 | 0.019 | 0.095 | BEST |
| 10 | 2.431 | 1.818 | 0.382 | 0.015 | 0.087 | BEST (peak) |
| 13 | 2.539 | 1.919 | 0.380 | 0.016 | 0.053 | pat 3 |
| 15 | 2.726 | 2.052 | 0.411 | 0.019 | 0.046 | pat 5 (stopped) |
v10 Historical Results (21 epochs, EGNN — superseded)
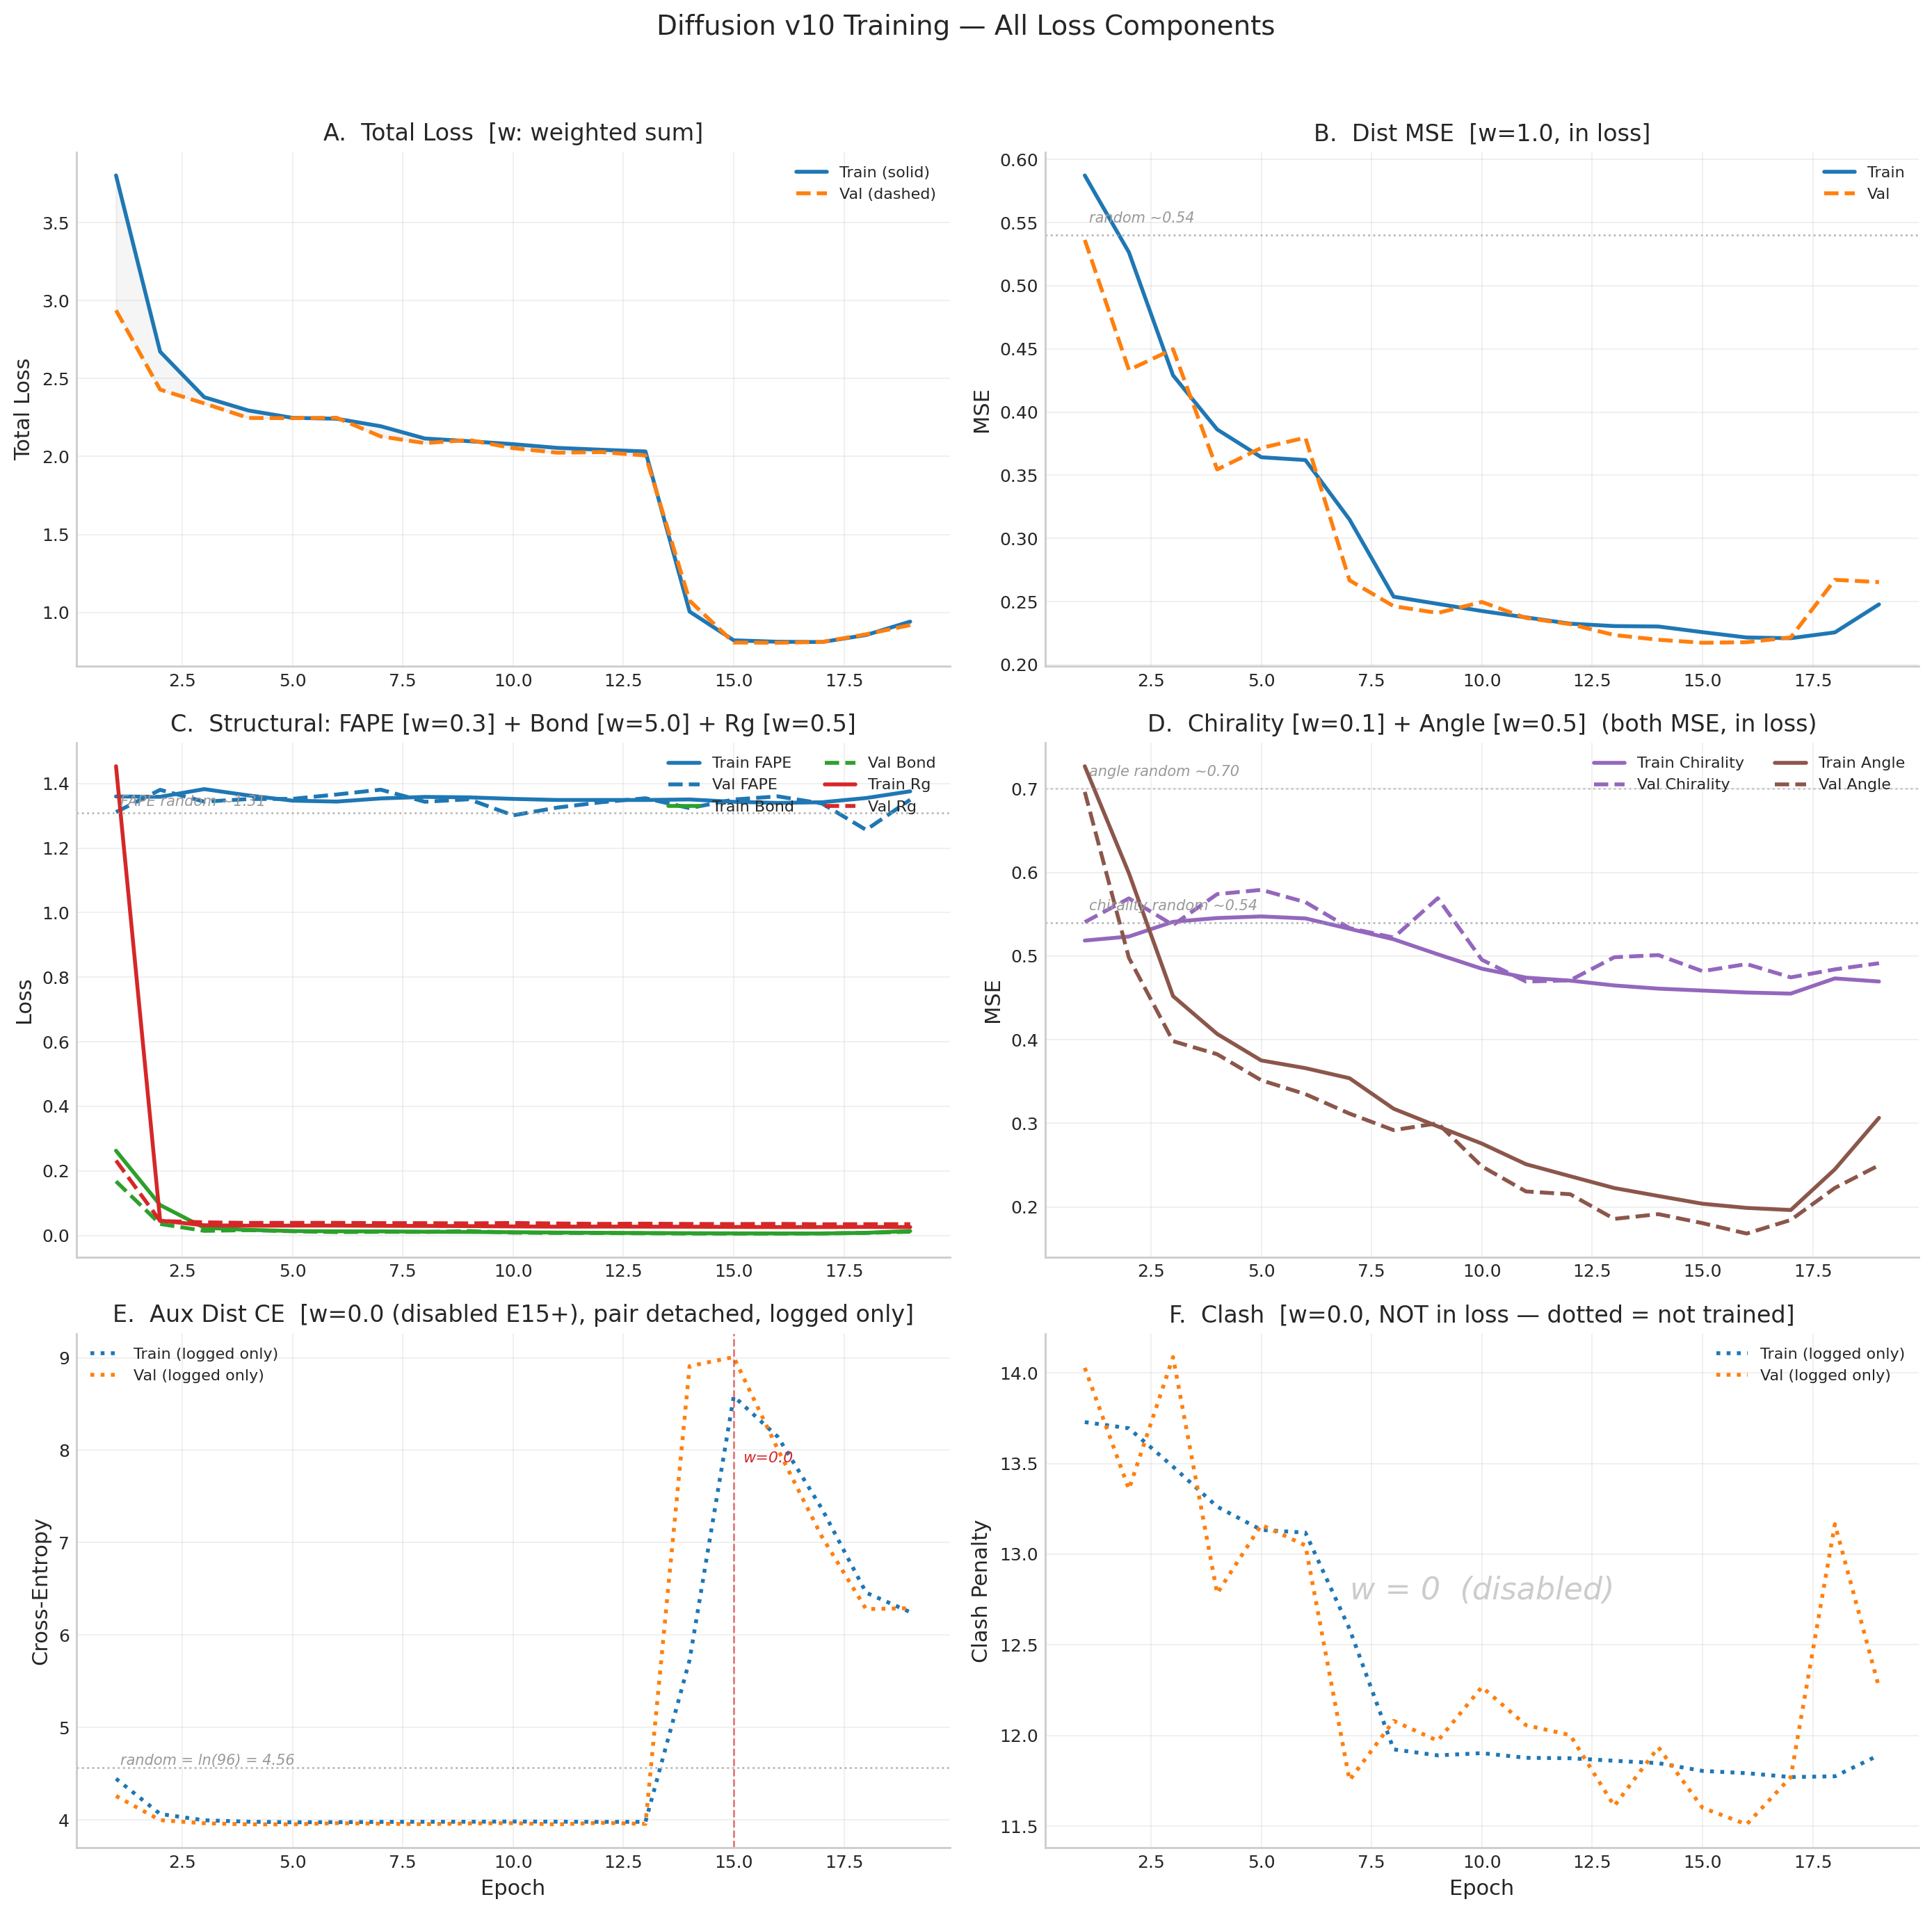
v10 used an 8-layer EGNN denoiser (14.6M params). After 21 epochs: dist_mse 60% below random (0.218), bond essentially solved (0.006), but FAPE stuck at random (~1.31) and TM-score peaked at 0.131. Best val structural = 0.805 (E16). DDIM best: TM=0.131, RMSD=14.53Å.
Encoder Variants — Full Comparison
All Encoder Models
| Model | Params | SS Acc | Contact F1 | Contact P | Contact R | Dist Acc | MLM Acc | Class Acc | Val Loss |
|---|---|---|---|---|---|---|---|---|---|
| v1 original | 1.2M | 46.5% (probe) | 0.498 | 0.367 | 0.773 | — | — | 66.3% | 3.988 |
| v2 original | 13.3M | 78.7% | 0.508 | 0.380 | 0.770 | 62.5% | 19.2% | 69.2% | 6.055 |
| v2 small E15 | ~5M | 78.7% | 0.521 | 0.398 | 0.753 | 62.5% | 19.6% | 68.1% | 6.048 |
| v2 reg E8 | ~13.3M | 78.6% | 0.491 | 0.359 | 0.777 | 62.2% | 19.0% | 67.6% | 6.053 |
| v2 sm+reg E3 | ~5M | 78.6% | 0.523 | 0.409 | 0.724 | 61.6% | 17.2% | 50.8% | 6.676 |
Per-Task Best
V2 Architecture Comparison
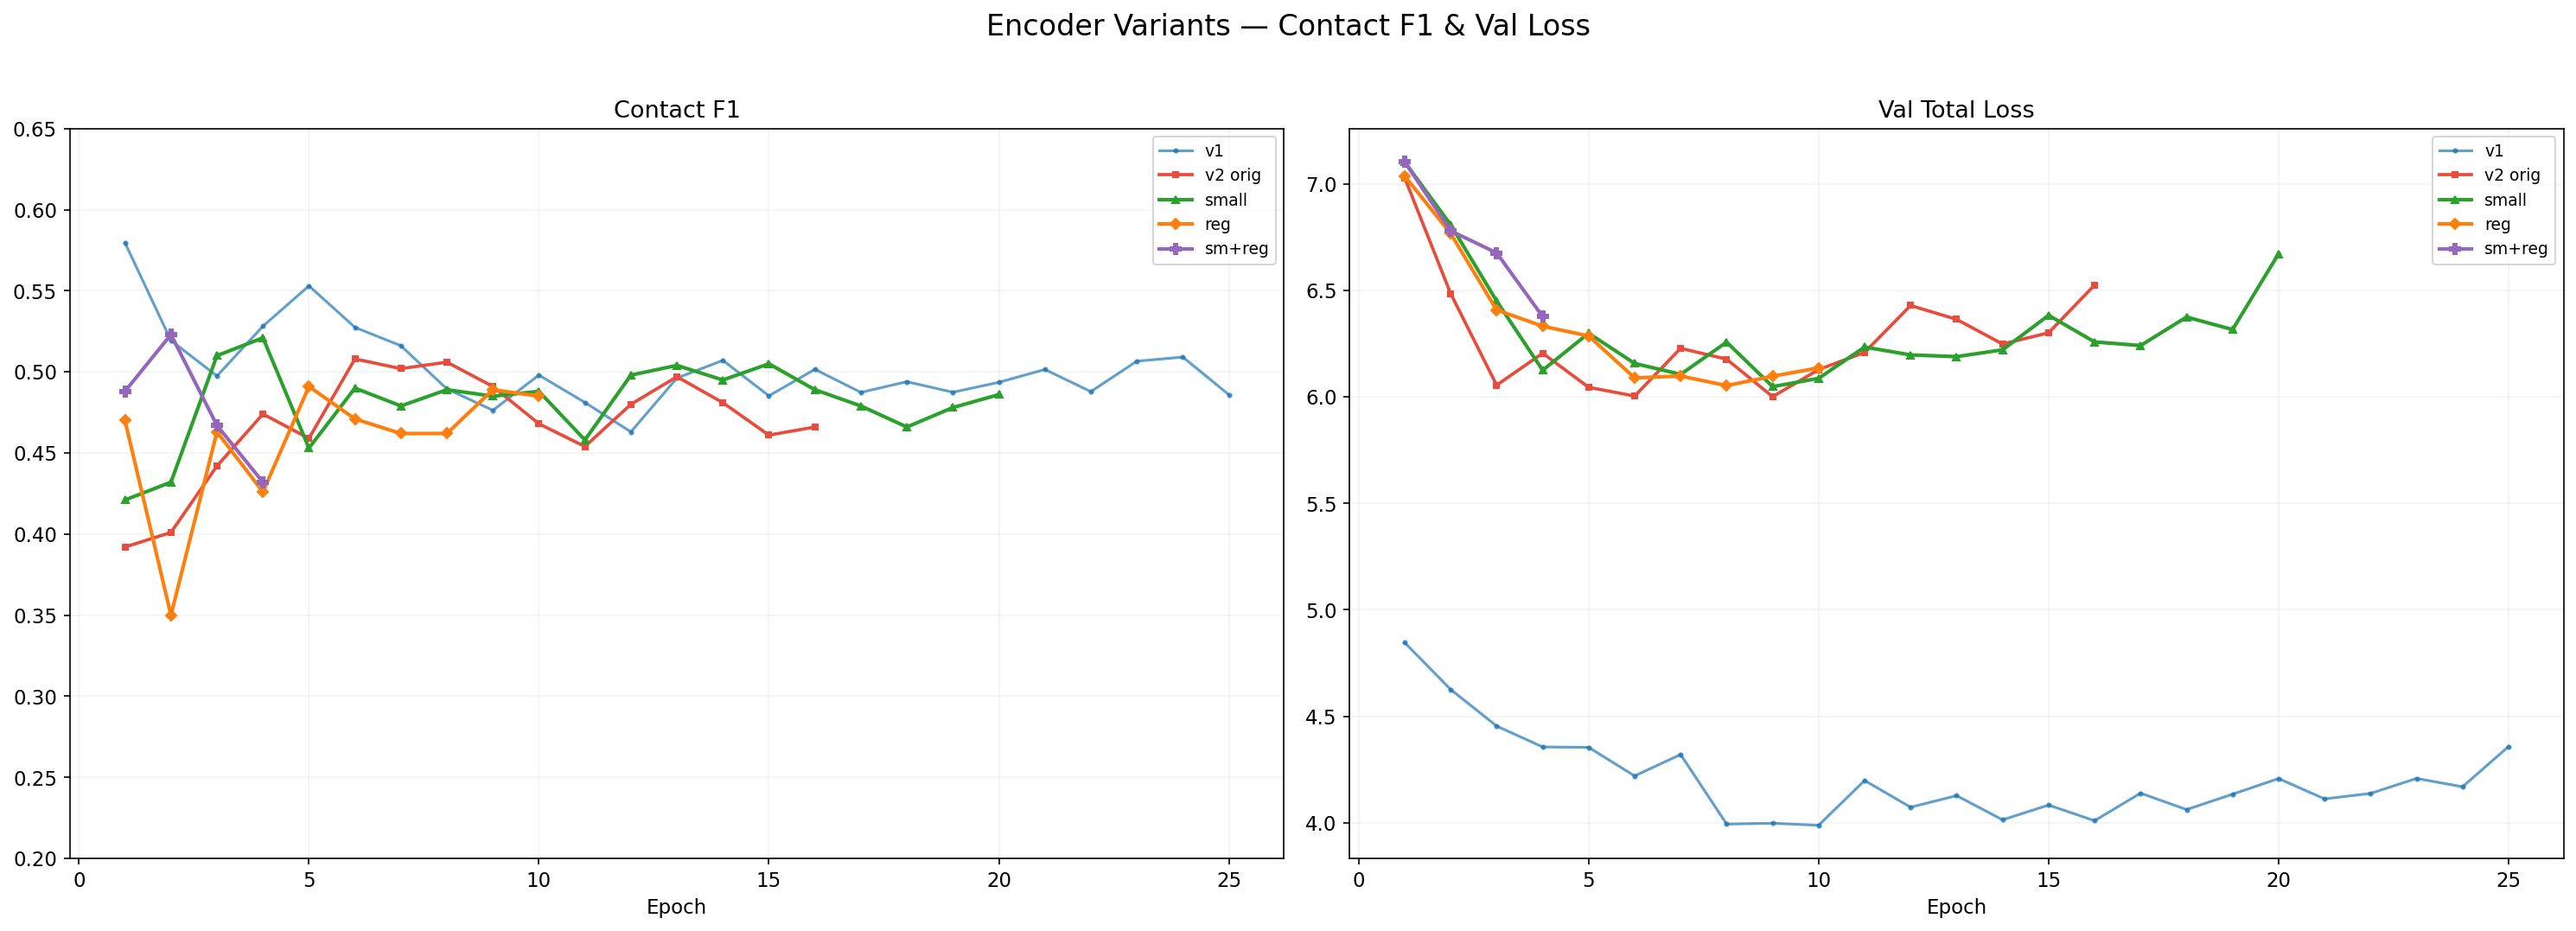
V2 variants: architecture sweep (size vs regularization). All hit SS=78.7%, F1~0.52 ceiling.
V3 Sweep — Breaking the Ceiling with Better Training Objectives
Same 5M architecture, 10 variants testing: span masking (mask 5-15 contiguous residues), contrastive learning (InfoNCE on CATH topology), distance regression (smooth L1 on real distances), SS segment masking (mask entire helices/sheets). span_dist broke through the v2 F1 ceiling!
V3 Sweep Results
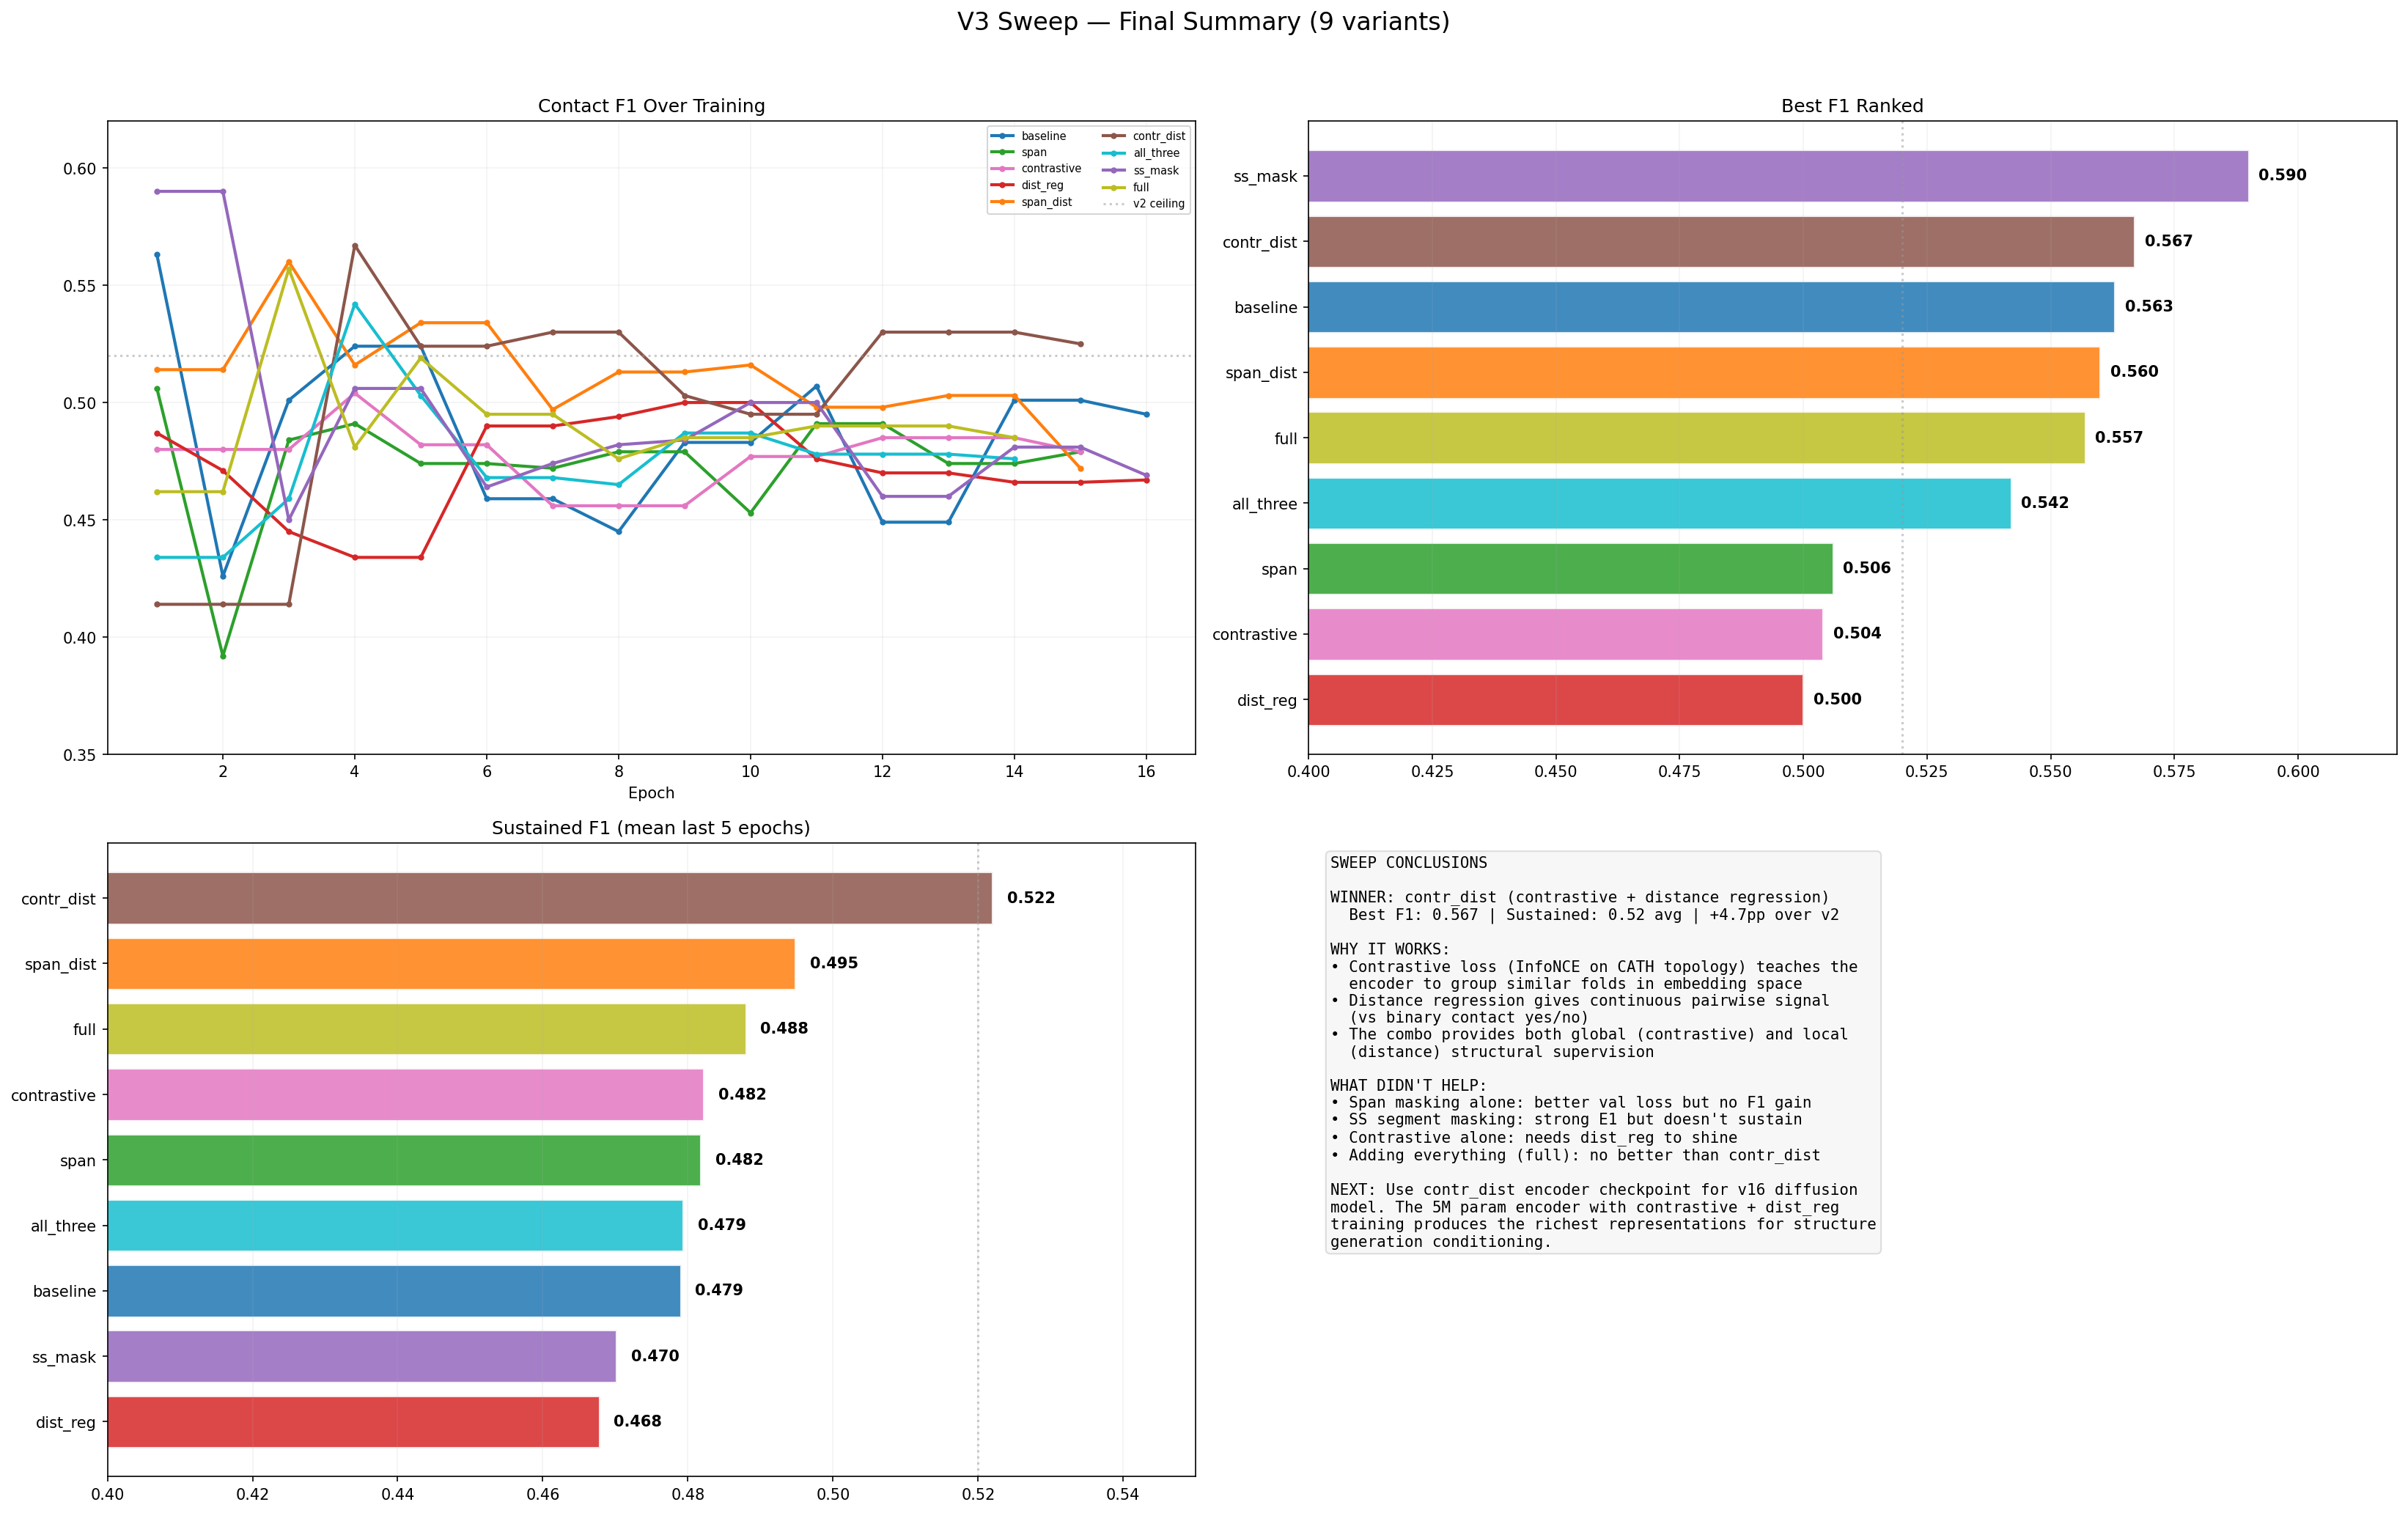
Row 1: F1 curves, val loss, precision. Row 2: recall, best F1 bars, latest F1 bars. Row 3: improvement over v2, objective matrix heatmap (sorted by best F1), key findings.
Encoder Analysis — UMAPs, Contact Maps, SS Probes
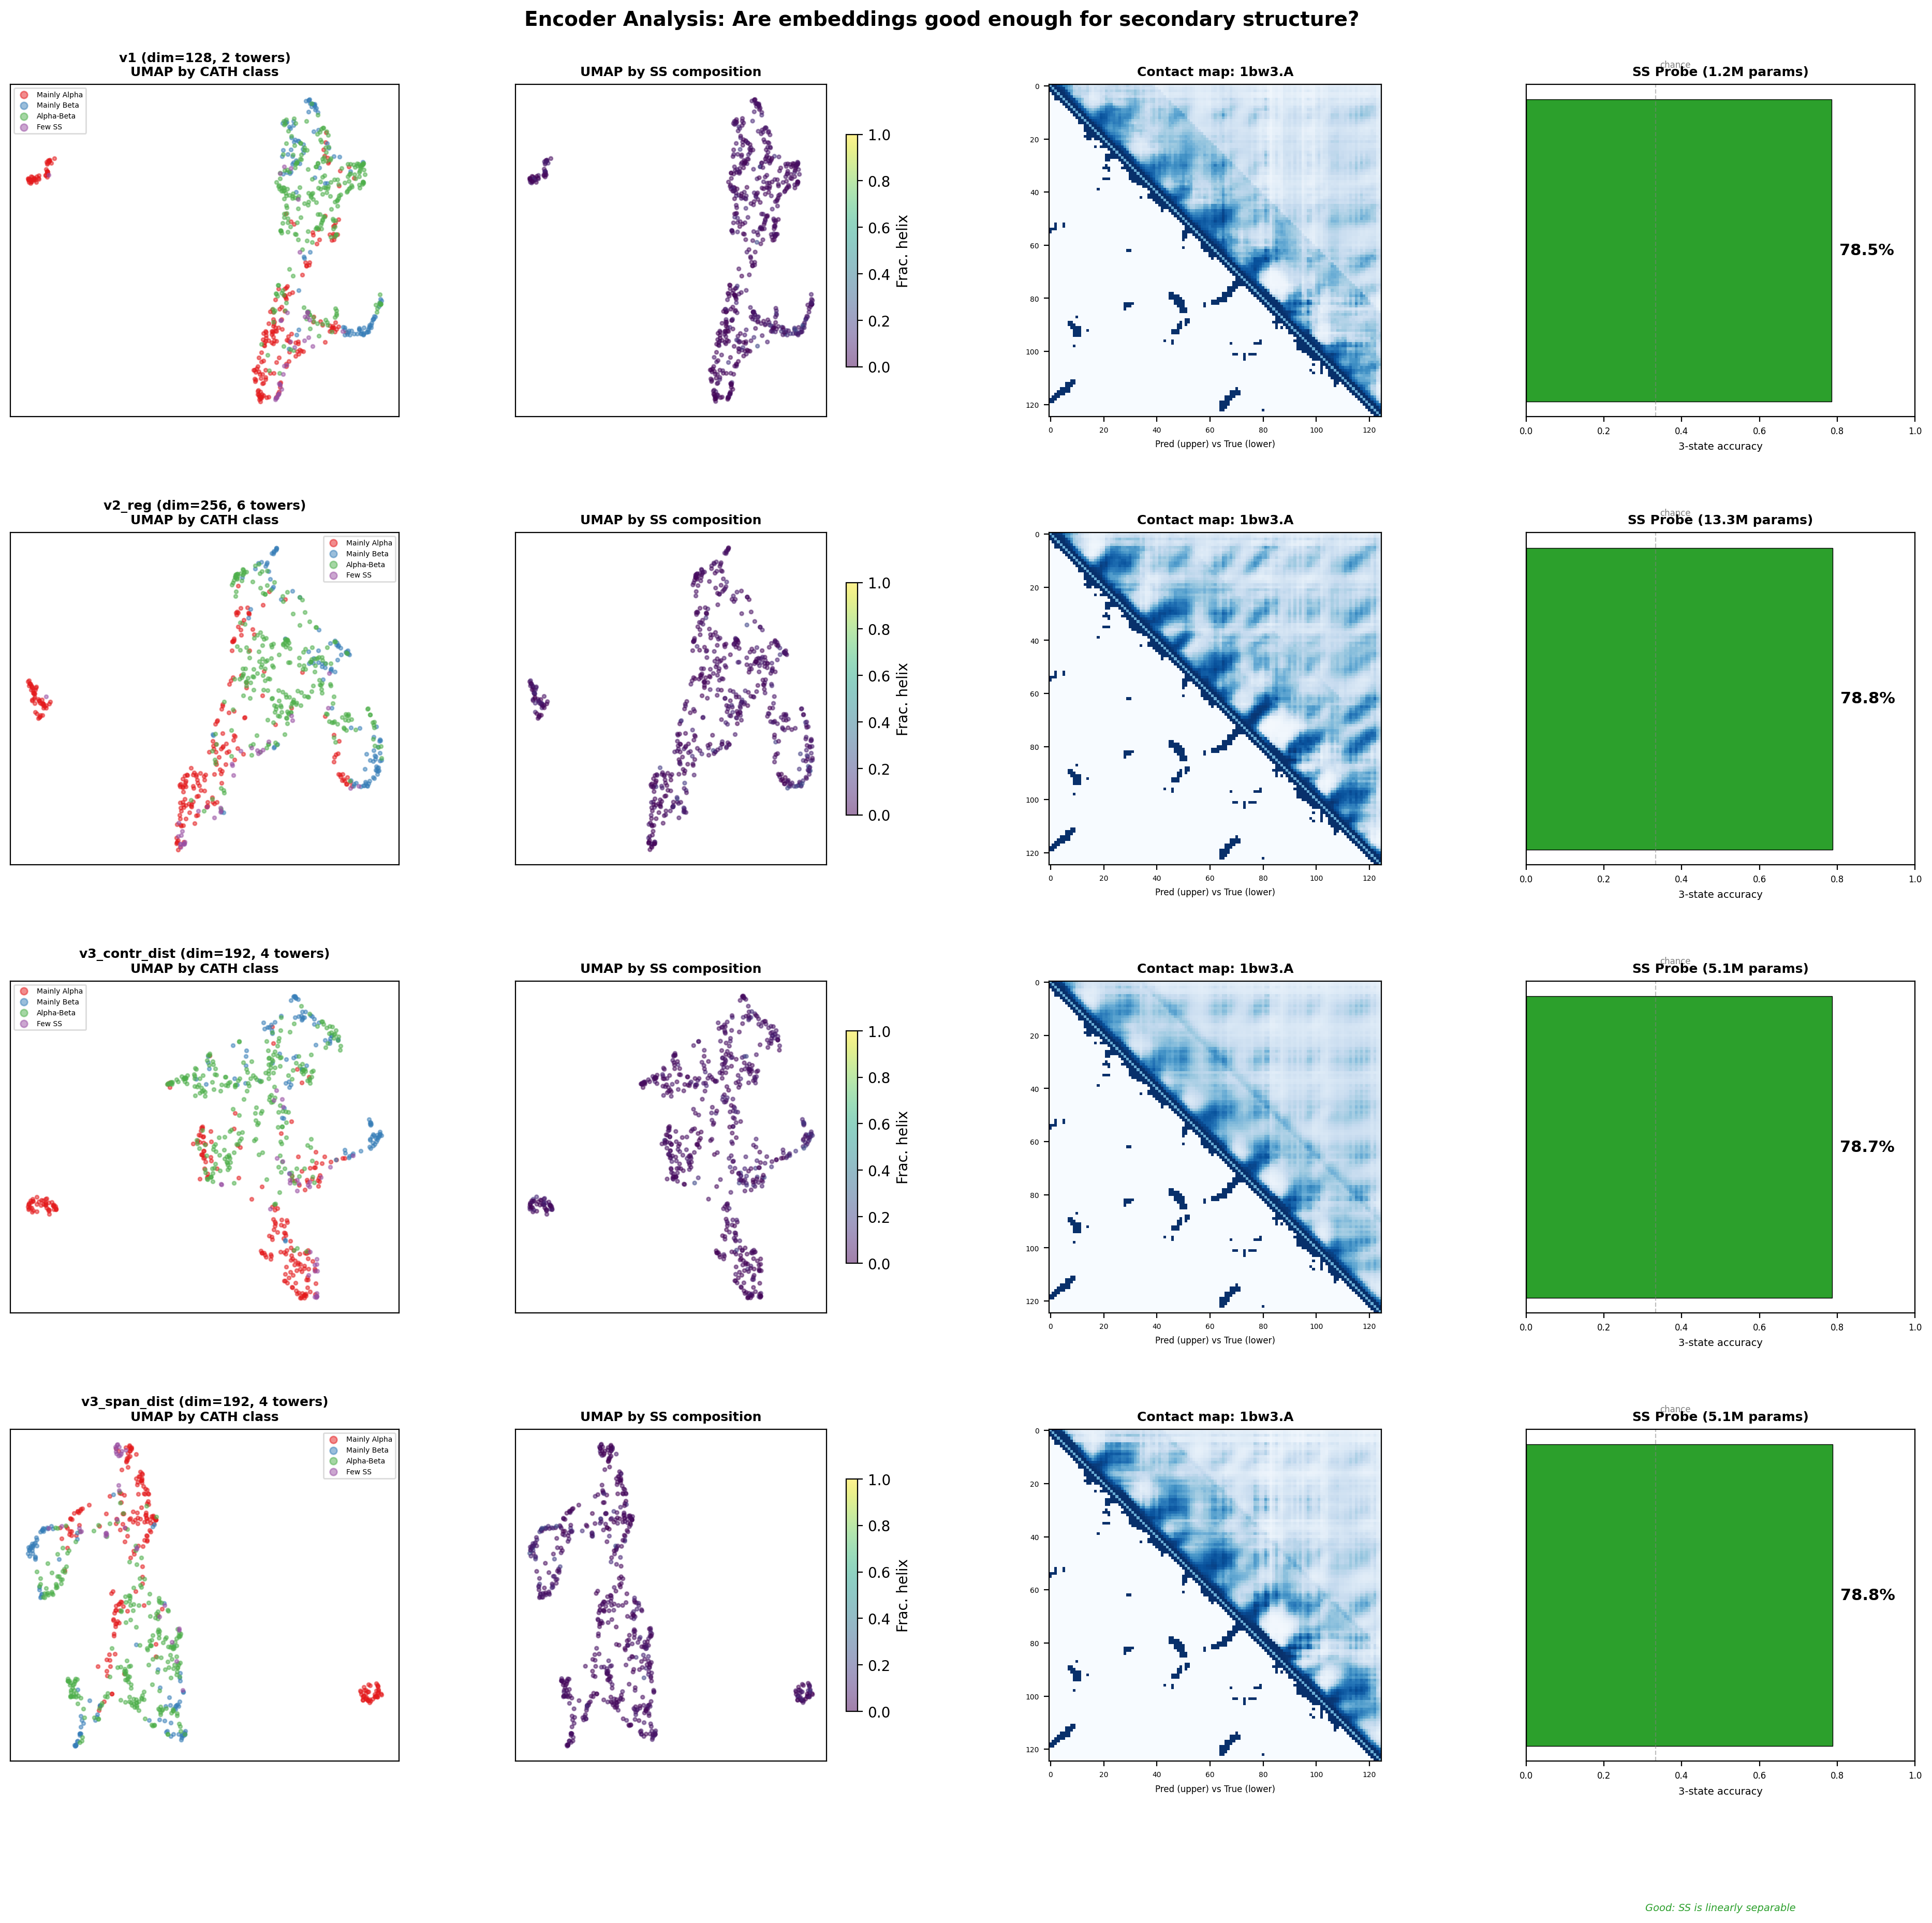
4 models × 4 panels: UMAP by CATH class, UMAP by SS composition, predicted vs true contact map, SS linear probe accuracy.
Are these encoders good enough for structure prediction?
Yes. All encoders achieve ~78.5–78.8% SS accuracy from a single linear probe — well above the 60% threshold. The SS information is encoded in the single representations. The real differentiator between encoders is contact map quality (F1) and UMAP fold clustering, which determine whether the pair stack can extract long-range structural relationships. The v3_contr_dist encoder (F1=0.567, contrastive-trained) provides the richest representations for v16.
| Variant | New Objectives | E3 F1 | Best F1 | E3 Loss | vs V2 Ceiling | Status |
|---|---|---|---|---|---|---|
| 7. contr_dist | contrastive + dist regression | E4 | 0.567 | 6.764 | +4.7pp | LEADER |
| 6. span_dist | span mask + dist regression | E8 | 0.560 (E3) | 6.325 | +4.0pp | sustained |
| 10. full | span + contr + dist + ss_mask | E4 | 0.557 (E3) | 7.175 | +3.7pp | surging |
| 8. all_three | span + contr + dist reg | E4 | 0.542 (E4) | 6.857 | +2.2pp | improving |
| 9. ss_mask | SS segment masking | E8 | 0.590 (E1) | 5.938 | +7.0pp (E1) | best loss, F1 oscillates |
| 1. baseline | (control) | E8 | 0.563 (E1) | 6.277 | +4.3pp (E1) | declining |
| 3. contrastive | contrastive only | E4 | 0.504 (E4) | 6.696 | −1.6pp | improving |
| 4. dist_reg | distance regression only | E8 | 0.494 (E8) | 6.396 | −2.6pp | slow climb |
| 2. span | span masking only | E8 | 0.506 (E1) | 6.110 | −1.4pp | best generalizer |
Variant Training Progress (last 5 epochs each)
| Variant | Epoch | Val Loss | SS Acc | Contact F1 | Dist Acc | MLM Acc | Class Acc | Status |
|---|---|---|---|---|---|---|---|---|
| v2 small (5M, dim=192, 4 towers, drop=0.30) | ||||||||
| 11 | 6.234 | 78.6% | 0.458 | 62.3% | 18.6% | 67.4% | pat 2 | |
| 12 | 6.197 | 78.6% | 0.498 | 62.4% | 19.6% | 67.1% | pat 3 | |
| 13 | 6.189 | 78.7% | 0.504 | 62.5% | 19.1% | 67.3% | pat 4 | |
| 14 | 6.221 | 78.7% | 0.495 | 62.5% | 19.1% | 68.1% | pat 5 | |
| 15 | 6.383 | 78.7% | 0.505 | 62.5% | 19.6% | 68.1% | pat 6 | |
| v2 regularized (13M, dim=256, 6 towers, drop=0.45, wd=0.10) | ||||||||
| 4 | 6.332 | 78.6% | 0.426 | 62.2% | 19.0% | 63.2% | best | |
| 5 | 6.286 | 78.3% | 0.491 | 62.1% | 18.2% | 63.8% | best | |
| 6 | 6.089 | 78.7% | 0.471 | 62.3% | 19.1% | 67.3% | best | |
| 7 | 6.098 | 78.7% | 0.462 | 62.2% | 19.0% | 68.1% | pat 1 | |
| 8 | 6.053 | 78.6% | 0.462 | 62.2% | 18.7% | 67.6% | best | |
| v2 small+reg (5M, dim=192, 4 towers, drop=0.40, wd=0.08) — 1080ti | ||||||||
| 1 | 7.104 | 78.6% | 0.488 | 61.4% | 12.7% | 41.8% | best | |
| 2 | 6.780 | 78.6% | 0.523 | 61.6% | 17.2% | 50.8% | best | |
| 3 | 6.676 | 78.6% | 0.467 | 62.0% | 18.0% | 56.1% | best | |
New Variants
dropout=0.30
dropout=0.45, wd=0.10
dropout=0.40, wd=0.08
Encoder V2 Original — 6-Task Multi-Scale Encoder
Encoder V2
TrainingTraining Progress
| Epoch | Total Loss | Class Acc | SS Acc | Contact F1 | Dist Acc | MLM Acc | Status |
|---|---|---|---|---|---|---|---|
| 1 | 7.029 | 46.5% | 78.6% | 0.392 | 61.8% | 16.4% | NEW BEST |
| 2 | 6.485 | 56.4% | 78.6% | 0.401 | 62.1% | 18.1% | NEW BEST |
| 3 | 6.055 | 67.4% | 78.6% | 0.442 | 62.3% | 18.3% | NEW BEST |
| 4 | 6.205 | 59.7% | 78.5% | 0.474 | 62.4% | 18.8% | NEW BEST |
Training Tasks (6)
Encoder V1 — Contact Classifier (Stage 1)
Contact Classifier (Stage 1 — Multi-task Encoder)
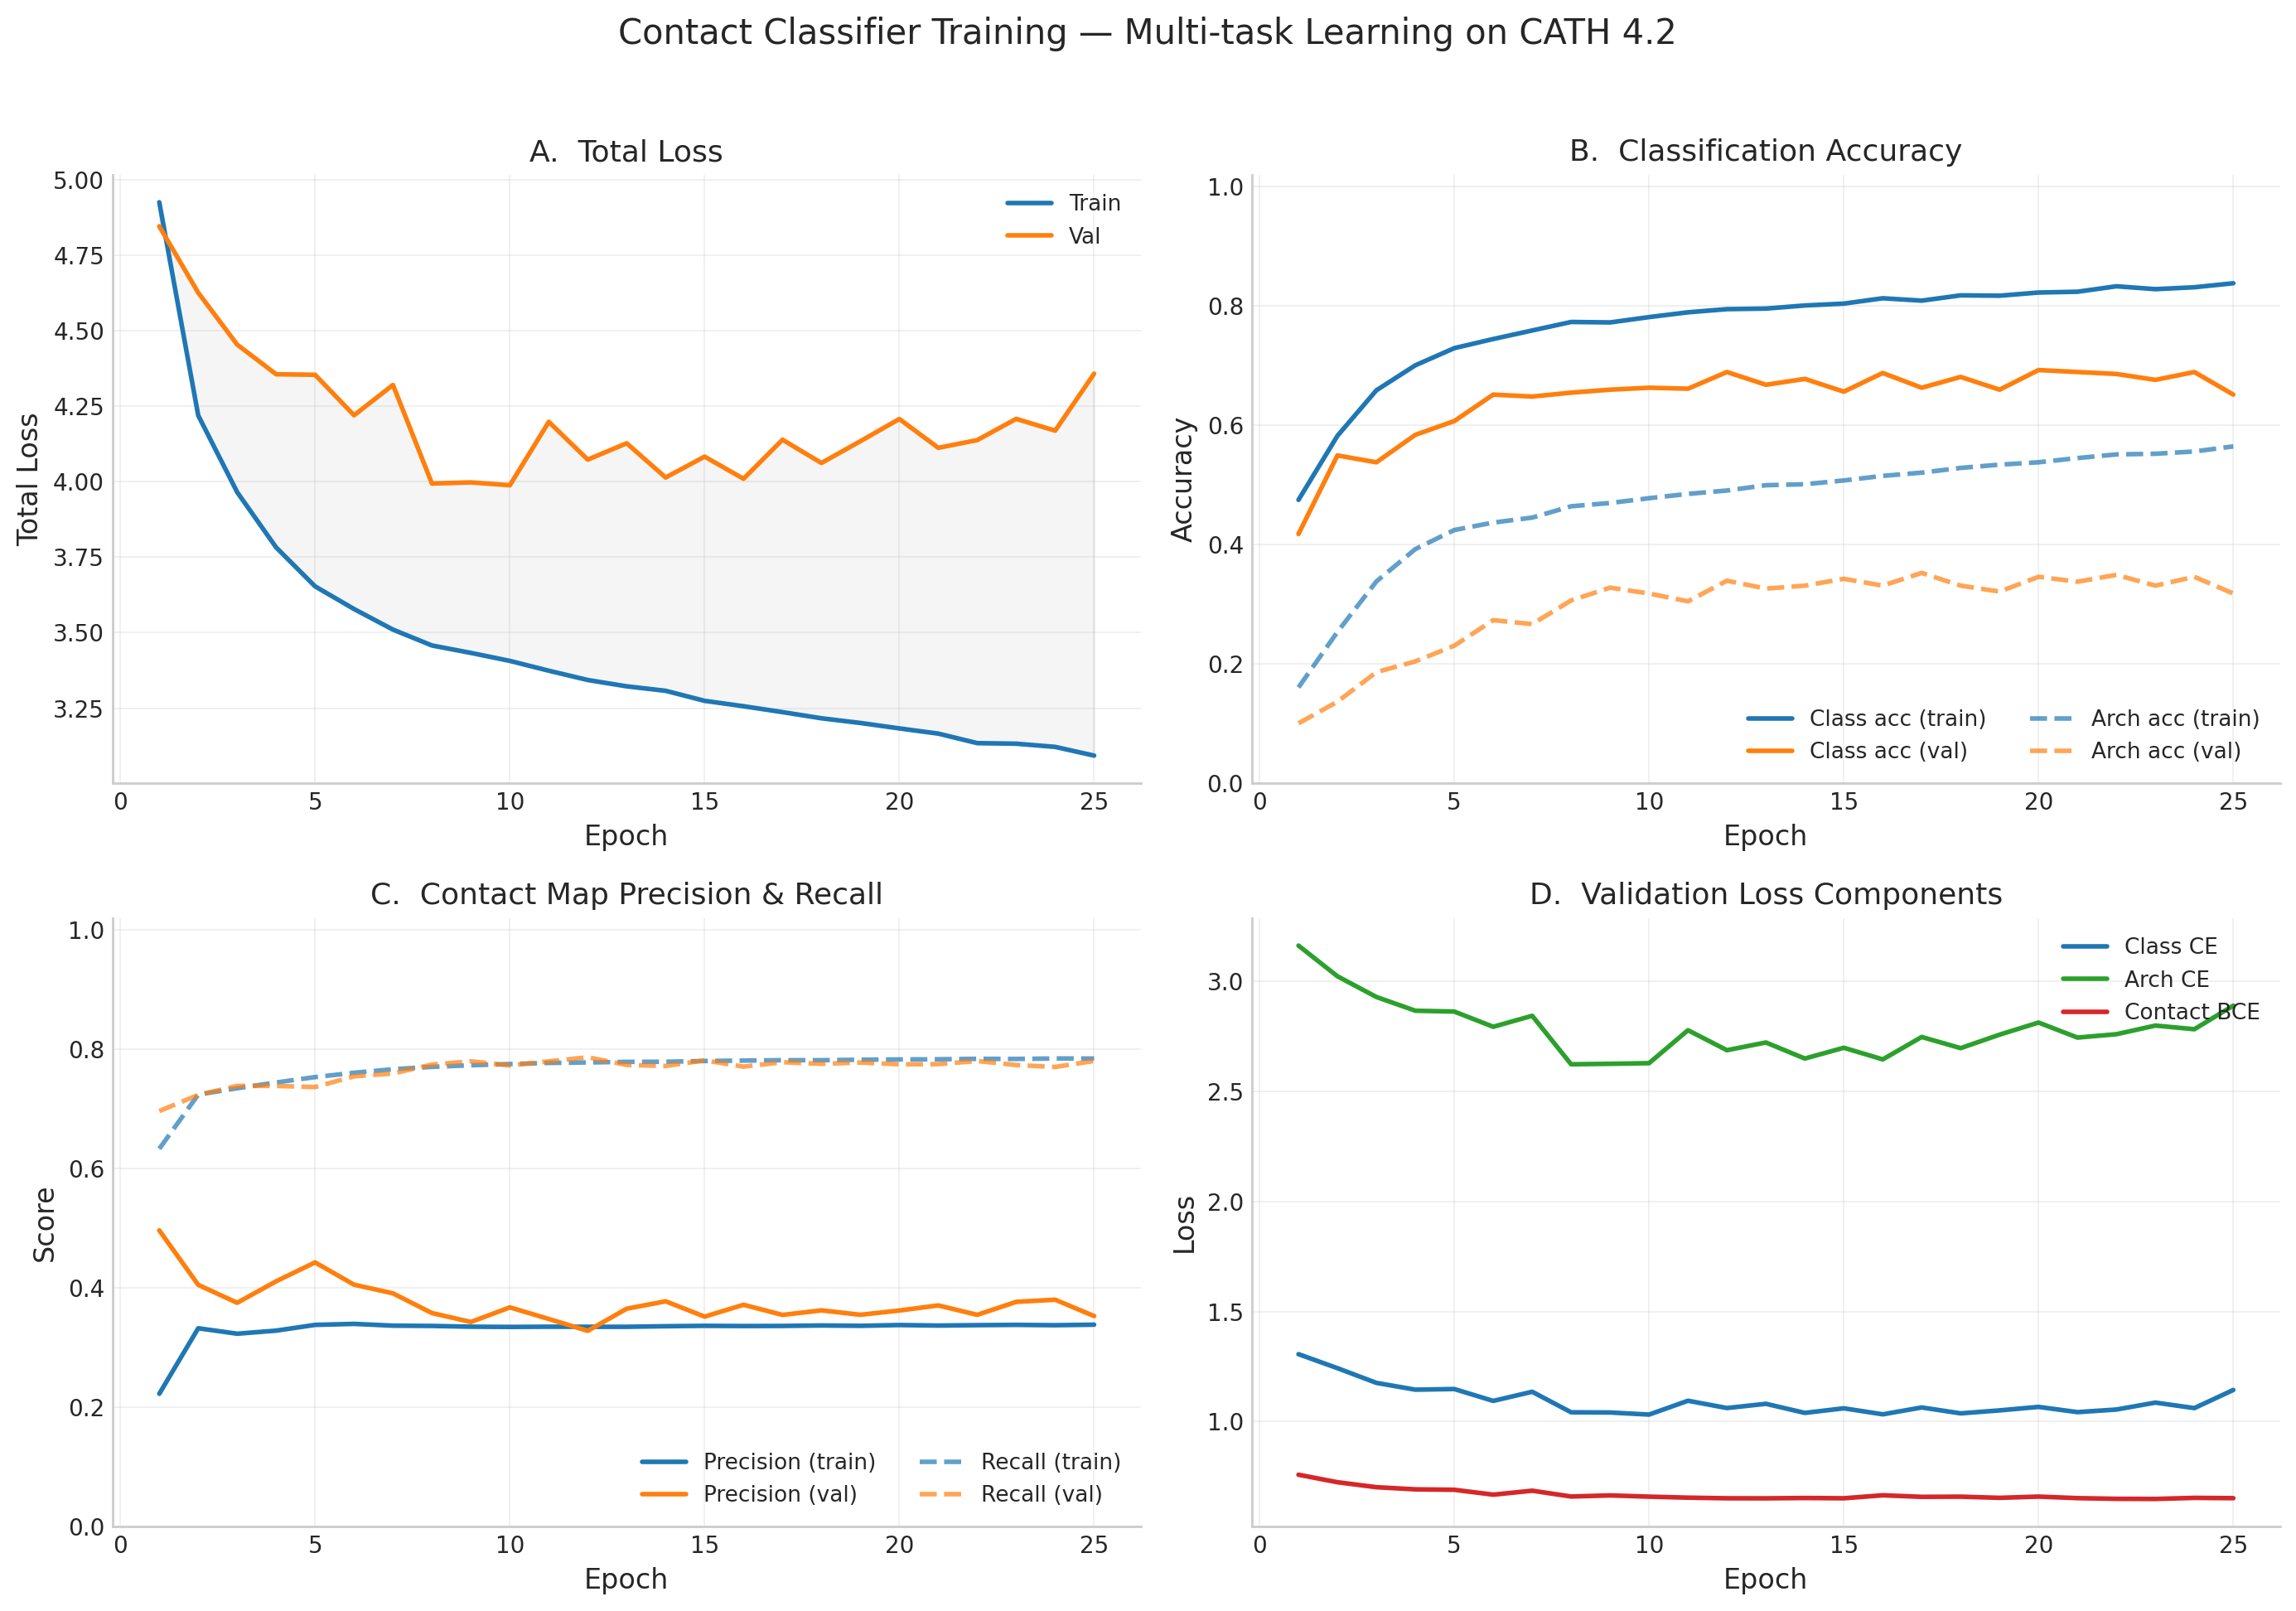
CompleteTraining Progress (all 25 epochs — early stopped)
| Epoch | Val Total Loss | Train Class Acc | Val Class Acc | Train Arch Acc | Contact Recall (Val) | Contact BCE (Val) | LR | Status |
|---|---|---|---|---|---|---|---|---|
| 1 | 4.846 | 47.5% | 41.8% | 16.1% | 69.6% | 0.759 | 3.33e-05 | NEW BEST |
| 2 | 4.626 | 58.2% | 54.9% | 25.4% | 72.3% | 0.725 | 6.67e-05 | NEW BEST |
| 3 | 4.454 | 65.9% | 53.8% | 33.8% | 73.9% | 0.702 | 1.00e-04 | NEW BEST |
| 4 | 4.356 | 70.0% | 58.4% | 39.2% | 73.8% | 0.693 | 1.33e-04 | NEW BEST |
| 5 | 4.354 | 72.9% | 60.7% | 42.4% | 73.7% | 0.691 | 1.67e-04 | NEW BEST |
| 6 | 4.220 | 74.4% | 65.1% | 43.7% | 75.5% | 0.668 | 2.00e-04 | NEW BEST |
| 7 | 4.321 | 75.9% | 64.8% | 44.5% | 75.9% | 0.686 | 2.00e-04 | pat 1 |
| 8 | 3.994 | 77.3% | 65.5% | 46.4% | 77.4% | 0.660 | 1.99e-04 | NEW BEST |
| 9 | 3.998 | 77.2% | 66.0% | 47.0% | 78.0% | 0.665 | 1.98e-04 | pat 1 |
| 10 | 3.988 | 78.1% | 66.3% | 47.8% | 77.3% | 0.659 | 1.97e-04 | BEST (final) |
| 11 | 4.199 | 78.9% | 66.1% | 48.5% | 78.0% | 0.655 | 1.96e-04 | pat 1 |
| 12 | 4.073 | 79.4% | 68.9% | 49.1% | 78.7% | 0.652 | 1.94e-04 | pat 2 |
| 13 | 4.128 | 79.5% | 66.8% | 49.9% | 77.4% | 0.652 | 1.92e-04 | pat 3 |
| 14 | 4.014 | 80.1% | 67.8% | 50.1% | 77.2% | 0.653 | 1.89e-04 | pat 4 |
| 15 | 4.083 | 80.4% | 65.6% | 50.7% | 78.1% | 0.652 | 1.87e-04 | pat 5 |
| 16 | 4.010 | 81.3% | 68.8% | 51.5% | 77.1% | 0.666 | 1.84e-04 | pat 6 |
| 17 | 4.139 | 80.9% | 66.3% | 52.1% | 77.8% | 0.659 | 1.80e-04 | pat 7 |
| 18 | 4.062 | 81.8% | 68.1% | 52.8% | 77.5% | 0.659 | 1.77e-04 | pat 8 |
| 19 | 4.134 | 81.7% | 66.0% | 53.4% | 77.8% | 0.654 | 1.73e-04 | pat 9 |
| 20 | 4.208 | 82.2% | 69.2% | 53.8% | 77.5% | 0.660 | 1.69e-04 | pat 10 |
| 21 | 4.112 | 82.4% | 68.9% | 54.5% | 77.5% | 0.653 | 1.64e-04 | pat 11 |
| 22 | 4.138 | 83.3% | 68.6% | 55.1% | 78.0% | 0.650 | 1.60e-04 | pat 12 |
| 23 | 4.208 | 82.8% | 67.6% | 55.2% | 77.3% | 0.649 | 1.55e-04 | pat 13 |
| 24 | 4.169 | 83.1% | 68.9% | 55.6% | 77.0% | 0.654 | 1.50e-04 | pat 14 |
| 25 | 4.358 | 83.8% | 65.1% | 56.4% | 78.0% | 0.652 | 1.45e-04 | EARLY STOP |
Final Results
- Best val loss: 3.988 at epoch 10 (best weights saved)
- Val class accuracy: 66.3% (4-way CATH class), Val architecture accuracy: 31.8% (38+ architectures)
- Contact P=0.367, R=0.773, F1=0.498 at best checkpoint — model successfully learned spatial proximity from sequence
- Early stopped at epoch 25 (patience 15) — val loss plateaued after epoch 10
- 1.2M params, trained from scratch on CATH 4.2 (18k proteins)
Training Curves
Contact Map Predictions (3 test proteins)
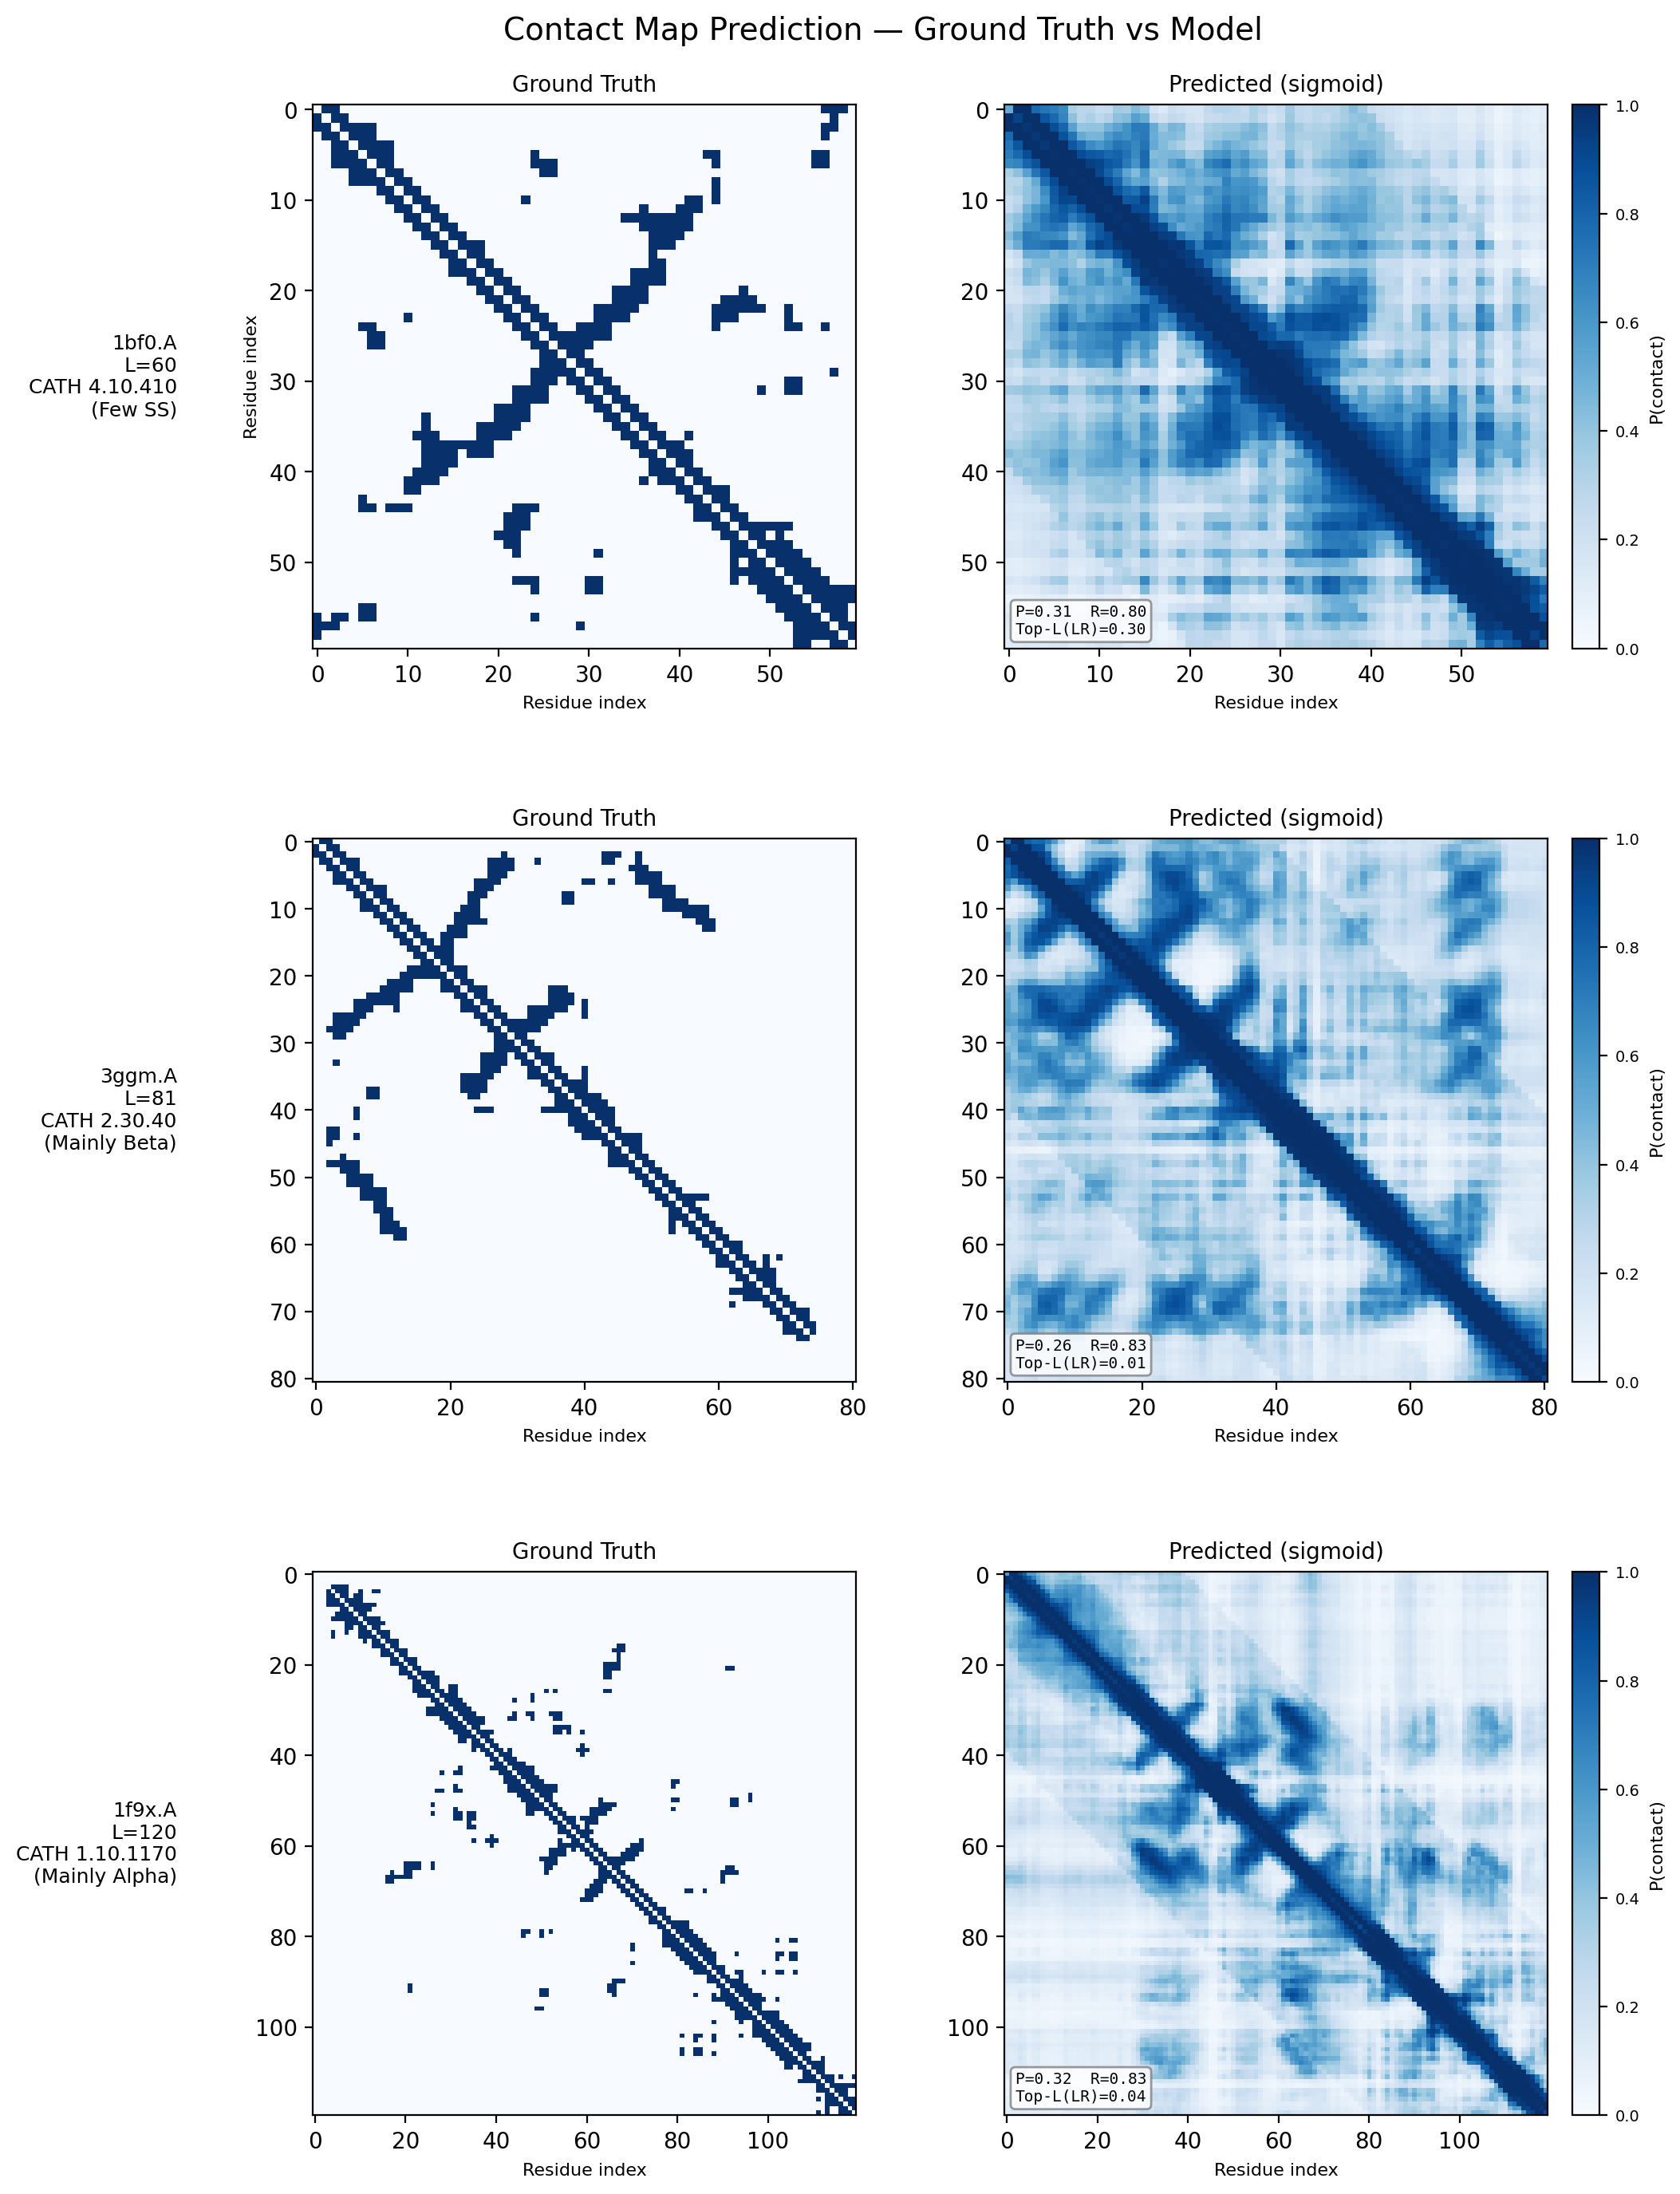
Each row shows a held-out test protein from a different CATH structural class. The left column is the ground truth contact map (binary: two Cα atoms < 8Å apart), and the right column is the model’s predicted probability of contact from sequence alone. Metrics (precision P, recall R, and Top-L long-range accuracy) are annotated on each prediction panel.
- 1bf0.A (L=60, Few Secondary Structure): A small protein with sparse, irregular contacts. The model captures the overall topology despite limited structural regularity.
- 3ggm.A (L=81, Mainly Beta): Beta-sheet proteins produce characteristic off-diagonal block patterns from strand–strand hydrogen bonding. The model recovers these long-range parallel and anti-parallel strand pairings well.
- 1f9x.A (L=120, Mainly Alpha): Alpha-helical proteins show strong banded diagonal patterns from helix-internal i→i+4 contacts. The model reproduces both the local helical periodicity and inter-helix contacts at larger separations.
Learned Embedding Space (PCA & UMAP)
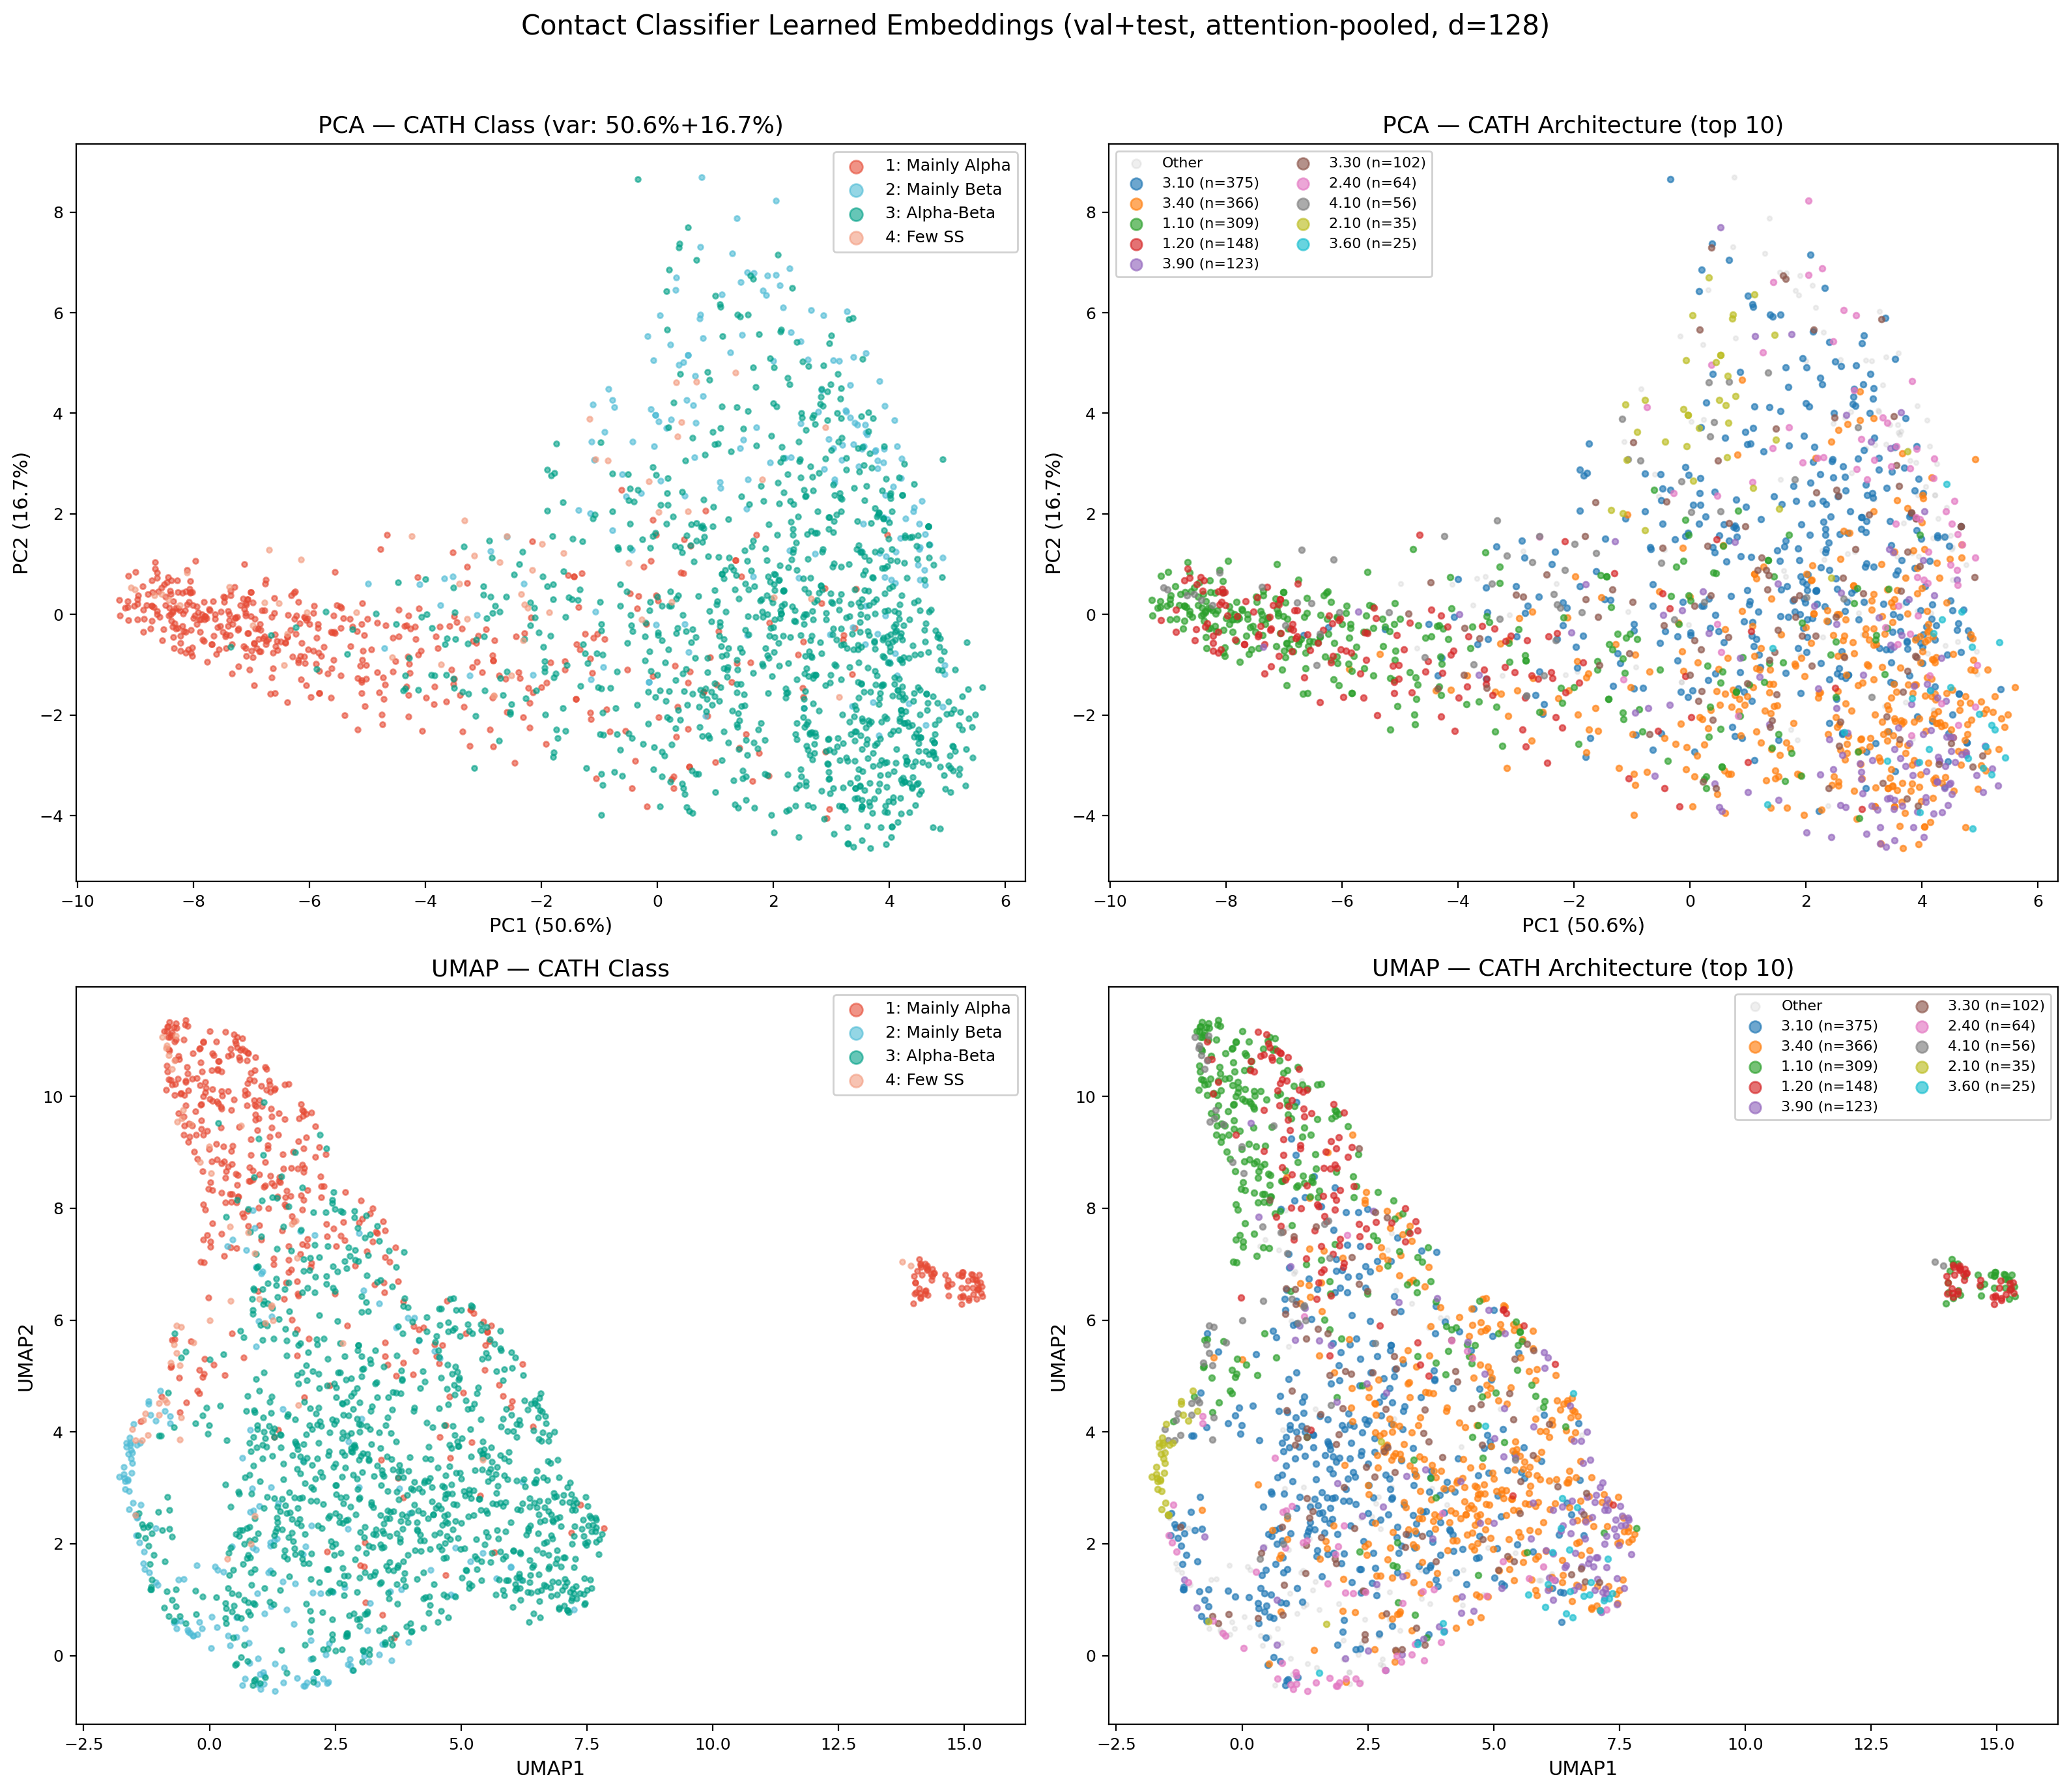
Attention-pooled protein embeddings (128-dim) from the encoder’s val+test set, projected via PCA and UMAP. The encoder learns to separate CATH classes without explicit contrastive loss — mainly-alpha and mainly-beta proteins form distinct clusters, while alpha-beta proteins span the intermediate region. UMAP reveals finer sub-structure at the architecture level, with several CATH architectures forming tight, well-separated clusters (e.g., 3.40 Rossmann fold, 1.10 orthogonal bundle). This confirms the multi-task training objective (classification + contact prediction) produces structurally meaningful representations suitable for conditioning the downstream diffusion model.
Model Evolution Timeline
x0_pred = t_vec discarded learned rotation matrices R. FAPE rebuilt frames via Gram-Schmidt, so rotations got no direct gradient. After E10, FAPE degraded to 2.052, TM collapsed to 0.046.
Architecture & Loss Function Details
How the Architecture Evolved
Mini-Fold’s current architecture (~35–38M parameters) is the result of fourteen iterations, each driven by a specific failure mode we needed to understand and fix. What follows is the story of those decisions — not a changelog, but the reasoning that shaped the model.
The Topology Ceiling: Why We Abandoned Equivariant Graph Networks
We started with an 8-layer SE(3)-equivariant graph neural network (EGNN) as the denoiser. The appeal was obvious: EGNN is equivariant by construction, meaning it respects physical symmetries without needing data augmentation. After months of training across several iterations, we hit a hard wall. The model learned that “proteins are compact blobs of the right size” — distance MSE dropped 60% below random baseline, bond lengths converged — but FAPE stayed stuck at ~1.31 (the random baseline) and TM-scores never exceeded 0.131.
The root cause was architectural: EGNN passes messages based on pairwise distances and updates coordinates through distance-weighted vectors. It has no concept of local reference frames. FAPE measures frame-aligned point error — how well the structure looks from each residue’s perspective — and EGNN has no inductive bias to optimize this. The model could get global shape roughly right but could never learn which helix packs against which sheet, which loop connects where.
The IPA Pivot: Learning to Think in Local Frames
The breakthrough came when we replaced EGNN with Invariant Point Attention (IPA), the structure module from AlphaFold2 (Jumper et al., Nature 2021). Each of the 8 IPA layers performs three operations:
- Invariant Point Attention — multi-head attention on the single representation, augmented with pair bias and 3D point attention. Each head generates query/key/value points in \(\mathbb{R}^3\) transformed into each residue’s local frame. Attention weights depend on geometric distances between learned points — invariant to global rotation/translation.
- Transition MLP — 2-layer feedforward on the single representation.
- Frame update — predicts a small quaternion + translation update per residue, composed in the local frame (right-multiplication for SE(3) equivariance). Initialized near-zero so frames are approximately preserved in early training.
This was the single most important architectural decision in Mini-Fold’s development. IPA gave the model the ability to reason about local geometry — the exact thing FAPE demands. Within a few epochs, FAPE began dropping below the random baseline for the first time.
The Hidden Bug That Blocked Topology Learning
But IPA alone was not enough. Our first IPA-based model improved distances and bonds, then collapsed
around epoch 14. After extensive debugging, we found a single-line code error: x0_pred = t_vec
was silently discarding the learned rotation matrices from IPA. The FAPE loss was being computed using
Gram-Schmidt-rebuilt frames from predicted coordinates, so the rotation parameters received
zero gradient. The model could learn where atoms should be, but never learned how residues
should be oriented.
The fix was twofold: use the IPA-predicted rotations directly in FAPE computation, and add an explicit frame rotation loss (\(\mathcal{L}_{\text{rot}} = 1 - \cos\theta\)) that provides direct angular supervision. This single change — adding rotation loss — was the most important insight in Mini-Fold’s development. It unlocked real topology learning: FAPE dropped to 1.655 and frame_rot to 0.830 within 8 epochs.
Scaling Up: From 8M to 31M Parameters
With the rotation bug fixed, the next bottleneck was capacity. The model showed gradient competition
in the shared 128-dimensional single representation — the denoiser, pair stack, and auxiliary
heads were all fighting for the same limited bandwidth. We scaled the model roughly 4x
(8.4M to 31.1M parameters): d_ipa_hidden from 256 to 512, 8 attention heads, 8 query
points, and a 2-layer FrameUpdate MLP. This resolved the gradient competition and set a new record:
validation total loss of 2.413, FAPE 1.584, frame_rot 0.790.
Getting there required two training innovations. First, per-module gradient clipping: the denoiser clips at max_norm=1.0, the pair stack at 0.5. Without this, the pair stack’s gradients starved as the larger denoiser dominated updates. Second, a 3x learning rate multiplier for the pair stack, ensuring this smaller module could keep pace with the denoiser.
The Beta-Sheet Problem and the Current Architecture
Why Alpha-Helices Were Easy and Beta-Sheets Were Impossible
After the scaling breakthrough, we had record structural metrics — but visual inspection of
generated structures revealed a systematic failure. The model produced beautiful alpha-helices but
could not form beta-sheets. The diagnosis pointed to one number: max_rel_pos=32.
Our pair stack encoded relative position as a linear-clipped embedding with 65 bins covering separations from -32 to +32 residues. Alpha-helix hydrogen bonds connect residues i and i+4 — well within this window. But beta-sheet hydrogen bonds typically connect residues 20 to 100+ positions apart in sequence. Any pair separated by more than 32 positions had zero relative position signal. The model was literally blind to the long-range contacts that define sheet topology.
Triangle Multiplicative Updates: Teaching the Model Transitivity
The current architecture (~35–38M params) makes three targeted changes to solve the beta-sheet problem. The proven IPA denoiser, auxiliary pair stack, R\(_g\) predictor, and distance head are all warm-started from the previous best checkpoint. The main pair stack is entirely new and trains from scratch.
The first change doubles the pair stack from 4 to 8 EnhancedPairBlock blocks, each now
equipped with Evoformer-style triangle multiplicative updates (outgoing + incoming) before the existing
row/column axial attention + FFN. The intuition behind triangle updates is transitivity: “if
residue i contacts residue k, and residue j contacts residue k,
then i and j are structurally related.” This is exactly how beta-sheet
topology works — two strands share contacts through connecting loop residues.
Implementation: each triangle update projects the pair representation to gate/value tensors
(tri_mul_dim=64), computes einsum('bikd,bjkd->bijd') (outgoing) or
'bkid,bkjd->bijd' (incoming), then projects back to d_pair=128.
The einsum is forced to fp32 to prevent fp16 overflow from the L-dimensional accumulation.
Output is clamped to [-1e4, 1e4] and returned as a residual delta to avoid catastrophic cancellation.
Log-Scaled Position Encoding: Seeing the Whole Protein
The second change replaces the linear-clipped relative position encoding (65 bins, max separation 32) with 128 log-spaced bins covering separations from 0 to 512 residues. The encoding is sign-aware (separate embeddings for upstream and downstream). The bin spacing reflects a simple biological insight:
- Bins 0–8: Linear spacing (1-residue resolution) for helix contacts (i+3, i+4)
- Bins 8–128: Log-spaced for long-range sheet contacts (i+20 to i+512)
Local structure needs fine-grained resolution; long-range contacts just need to be distinguishable
from each other. Additionally, 32-dimensional sinusoidal continuous RPE features (sin/cos encoding
projected to d_pair) provide smooth interpolation between discrete bins.
Classifier-Free Guidance: Conditional and Unconditional Generation
The third change adds classifier-free guidance (CFG) training. 10% of training batches
(p_uncond=0.1) replace residue tokens with MASK tokens (token ID 1), preserving
CLS/EOS/PAD structure so attention masks remain valid. This trains the model for both conditional
and unconditional generation. At sampling time, CFG enables guided generation:
ε = εuncond + w · (εcond − εuncond).
A subtle bug we caught early: our first implementation used PAD (token 0) as the
null token. Since the attention mask is computed as ids.ne(PAD), this produced an
all-False mask, creating degenerate pair representations that caused NaN. Using MASK (token 1)
instead preserves valid masks.
Key Design Patterns
Several design choices emerged through hard-won lessons across multiple iterations. They now form the foundation that all architecture variants build on.
SNR-Gated Frame Initialization
Per-residue rigid frames are built from noised C\(\alpha\) coordinates via Gram-Schmidt orthogonalization on consecutive backbone triplets. We discovered early on that at high noise (SNR < 1.0, roughly t > 700), the noised coordinates are near-isotropic and Gram-Schmidt is numerically unstable. Without intervention, the first IPA layer receives garbage frames, producing cascading errors through all 8 layers. Our solution smoothly blends toward identity frames as noise increases:
This was a major source of training instability before we identified and fixed it.
Frame-Aware Self-Conditioning
25% of training steps (reduced from 50% in earlier iterations): run a no-grad forward pass to get x\(_{0}^{\text{prev}}\), build clean frames from it (treated as t=0), and use those as the initial frames for the second pass. At high noise where x\(_t\) frames are identity, self-conditioning provides the model’s best guess at clean local geometry — the IPA layers refine good frames instead of building them from scratch.
We reduced SC probability from 50% to 25% after observing that higher rates meant fewer “cold start” training steps. The model needs enough cold-start experience to generalize at inference when no previous prediction exists.
Fixed-Scale Coordinates
All coordinates are divided by a fixed constant (10\(\text{\AA}\)) instead of per-protein R\(_g\). This seems like a minor choice, but it was one of the most impactful changes. R\(_g\) normalization made the noise schedule protein-size-dependent: a protein with R\(_g\)=5\(\text{\AA}\) had coordinate values ~1.0 while R\(_g\)=25\(\text{\AA}\) gave ~0.2–0.5, meaning the same noise level destroyed more signal for larger proteins. This silently capped TM-scores and looked like a “plateau” rather than a systematic bias. All successful protein diffusion models (FrameDiff, RFDiffusion, Genie) use fixed-scale coordinates — once we switched, the plateau disappeared.
Learning Rate Schedule and Numerical Stability
The current learning rate schedule uses three phases, motivated by the observation that breakthroughs happen in narrow LR windows:
- Warmup (3 epochs): Linear 0.01x to 1x base LR
- Constant (20 epochs): Hold at peak LR=2e-5 (pair_stack at 3x = 6e-5)
- Cosine decay (~37 epochs): Slow decay to eta_min=1e-6
During development we also uncovered three classes of fp16 instability (detailed in the NaN Debugging Story under the Structure Folding tab):
- fp16 epsilon underflow:
clamp(min=1e-6)underflows to 0 in fp16 (min positive ~6e-5). Fixed by forcing fp32 in Gram-Schmidt, slerp, IPA point attention, and all loss functions. - Triangle einsum overflow: L-dimensional accumulation exceeds fp16 max (65504).
Forced fp32 with
torch.amp.autocast("cuda", enabled=False). - Unsafe torch.cdist backward: Produces NaN when distance is exactly 0.
Replaced with manual
(diff.pow(2).sum(-1) + 1e-10).sqrt().
Loss Functions
Mini-Fold trains with a composite loss that blends global fold accuracy, local backbone geometry, and auxiliary supervision signals. Each term has a specific role motivated by failures in earlier model versions and by lessons from the protein structure prediction literature. The total loss is:
The grouping reflects a key design principle: global structure losses are hard and slow (they encode topology), while local geometry losses are easy and fast (they converge within a few epochs). Getting this balance wrong was the source of most training failures in v8–v10.
Global Structure Losses
These losses teach the model to produce correct protein folds — the right contacts, the right topology, the right orientations. They are the hardest to optimize and the primary drivers of structural quality.
FAPE — Frame-Aligned Point Error \(w = 1.0\)
Introduced by Jumper et al. in AlphaFold2 (Nature, 2021), FAPE is the gold standard loss for protein structure models. It measures how well predicted coordinates match ground truth in each residue’s local reference frame:
Unlike RMSD, which is a single global average, FAPE evaluates structure from every residue’s perspective. A model can have low RMSD by getting the overall shape roughly right, but FAPE requires getting the local neighborhoods correct — which helix packs against which sheet, which loop connects where.
Random baseline: ~1.31. Drops below 1.0 only when the model learns correct fold topology. This is the loss that distinguishes a blob from a protein.
Frame Rotation Loss \(w = 0.5\)
Direct supervision on per-residue backbone orientations, measuring the angular distance between predicted and ground-truth rotation matrices: \(\mathcal{L}_{\text{rot}} = 1 - \cos\theta\). This is conceptually similar to the auxiliary heads in AlphaFold2’s structure module, but applied directly to the IPA-predicted frames.
Why this loss exists (the v11 rotation bug): In v11, a code error (x0_pred = t_vec)
silently discarded the learned rotations from IPA. FAPE was computed using Gram-Schmidt-rebuilt frames, so
rotations received zero gradient. The model could reduce distance-based losses but never learned orientations.
Adding frame_rot was the single fix that unlocked topology learning — the most important architectural
insight in Mini-Fold’s development.
Random baseline: ~1.0 (frames pointing ~90° off). Target: <0.5. Currently at 0.86–0.88 — the model is learning orientations but still has significant room to improve.
Distance MSE \(w = 1.0\)
MSE on all pairwise C\(\alpha\) distances. Pairwise distance matrices (also called contact maps when thresholded) were the original representation used in early structure prediction methods (e.g., trRosetta, Yang et al., PNAS 2020). They’re easy to predict but fundamentally limited — many different 3D folds can produce similar distance distributions.
Random baseline: ~0.54. The easiest structural loss — even the EGNN models (v8–v10) could reduce this 60% below random. Useful as a stable gradient signal early in training before FAPE gradients become informative.
Local Geometry Losses
These losses enforce physical constraints on the backbone chain — correct bond lengths, angles, and handedness. They converge quickly (typically within 2–3 epochs) because they only require learning local patterns, not global topology. The key challenge is preventing them from dominating early training and blocking global structure learning.
Bond Geometry \(\beta(e) = \min(3.0,\; 1.0 + 2.0 \cdot \min(e/10, 1))\)
MSE between consecutive C\(\alpha\)–C\(\alpha\) distances and the ideal value of 3.8Å (the standard peptide bond length from crystallography). The weight is annealed from 1.0 to 3.0 over 10 epochs.
Why anneal? This was learned the hard way in v9. Starting with high bond weight causes the model to produce “bead-on-a-string” chains — perfectly spaced at 3.8Å but with no tertiary structure. The model satisfies the easy loss and ignores the hard one (FAPE). Annealing lets the model first explore topology, then gradually tightens the physical constraints.
Random baseline: ~0.17. Converged: <0.02 (bonds within 0.1Å of ideal). Currently at 0.009 — essentially solved.
Chirality \(w = 0.1\)
MSE on signed volumes (scalar triple products) of C\(\alpha\) quartets. Natural proteins are built exclusively from L-amino acids, which produces a consistent backbone handedness. Without explicit chirality supervision, diffusion models can generate mirror-image (D-amino acid) structures that score well on all other metrics — FAPE, RMSD, and distance MSE are all chirality-agnostic.
This is a known issue in the protein generation literature. FrameDiff (Yim et al., ICLR 2024) addresses it through SE(3) equivariance; we use an explicit loss term instead, which is simpler and equally effective for our architecture.
Bond Angle \(w = 0.5\)
MSE on cosines of C\(\alpha\)–C\(\alpha\)–C\(\alpha\) bond angles. The ideal angle is ~120° (\(\cos\theta \approx -0.5\)), reflecting the planar geometry of the peptide bond. Working in cosine space avoids the discontinuity at 0°/360° that plagues angular losses.
Random baseline: ~0.70. Converged: <0.1. Currently at 0.038 — solved.
Auxiliary Losses
These losses provide indirect training signals that stabilize learning without directly measuring structural quality. They have low weights and primarily serve as regularizers.
Radius of Gyration \(w = 0.5\)
A separate MLP predicts the protein’s absolute radius of gyration (R\(_g\)) from sequence embeddings, trained with MSE on log-transformed values. At inference, this recovers the correct physical scale when converting from normalized coordinates back to Angstroms.
Converges below 0.05 by epoch 2 and stays solved. The simplest loss — included for practical utility, not structural learning.
Auxiliary Distance Cross-Entropy \(w = 0.03\)
Ordinal regression on binned pairwise distances (32 bins, 2–40Å) from an independent lightweight pair stack (64-dim, ~500K params). Inspired by the distogram head in AlphaFold2, which predicts distance distributions as a byproduct of the pair representation.
Key design choice: The auxiliary pair stack is completely independent from
the main pair stack — no shared parameters, no gradient flow between them. This was a hard-won lesson
from v10, where the distance head read from the main pair stack via detach(). As the main
stack’s representations evolved during training, the distance head’s features drifted out of
distribution, causing aux_dist_ce to explode (3.95 → 38.8 over 3 epochs). A fully independent stack
avoids this coupling entirely.
DDIM Evaluation Metrics
Every 5 epochs, we generate structures via 50-step DDIM sampling (Song et al., ICLR 2021) using EMA weights and evaluate against ground truth. These metrics measure generative quality — how good the model’s samples are — as opposed to the training losses which measure denoising accuracy.
| Metric | What it measures | Random | Good | Reference |
|---|---|---|---|---|
| TM-score | Global fold similarity [0, 1]. Topology-sensitive, length-independent. | ~0.10 | >0.5 | Zhang & Skolnick, Proteins 2004 |
| CA-RMSD | Average atomic displacement after optimal superposition. | ~15–16Å | <5Å | Kabsch, Acta Cryst 1976 |
| GDT-TS | Fraction of residues within 1/2/4/8Å cutoffs, averaged. | ~3–4% | >50% | Zemla, Nucleic Acids Res 2003 |
Current status: At E5, v14’s DDIM samples give TM=0.111 (near random). Training losses are improving steadily but generative quality typically lags — expect a nonlinear jump in DDIM metrics around E10–15 once the denoiser learns enough of the score function for iterative refinement to work. This “phase transition” is well-documented in score-based diffusion models (Song et al., ICLR 2021).
Previous Architecture Details
v11/v12 — IPA-Based Frame Denoising (superseded by v13)
Why the pivot from v10: EGNN has no concept of local reference frames — it passes messages based on pairwise distances and updates coordinates through distance-weighted vectors. FAPE measures frame-aligned point error, which EGNN has no inductive bias to optimize. v11 replaced EGNN with IPA (AlphaFold2-style), explicitly maintaining per-residue rigid-body frames (R ∈ SO(3) + t ∈ ℝ³).
v11 → v11b: v11 had a critical bug: x0_pred = t_vec discarded learned R.
v11b added frame_rotation_loss and used learned R in FAPE. Best E8: FAPE 1.655, frame_rot 0.830.
Collapsed at E14 due to gradient competition in the shared 128-dim single representation.
v12: 4.1x capacity scaling (8.4M → 31.1M params). d_ipa_hidden: 256→512, 8 heads, 8 query points, 2-layer FrameUpdate MLP. Resolved gradient competition. Best E10: val_total 2.581. Then regressed E11–E13 due to gradient starvation of the pair stack.
v12b: Per-module gradient clipping (denoiser=1.0, pair_stack=0.5), pair_stack 3x LR. 31 epochs, 6 NEW BESTs. All-time record b30: val_total 2.413, FAPE 1.584, frame_rot 0.790.
| Loss | v10 | v11 | v11b/v12b | Rationale |
|---|---|---|---|---|
| FAPE | 0.3 | 1.0 | 1.0 | IPA can optimize frame consistency |
| Frame Rot | — | — | 0.5 | v11b fix: direct angular loss on learned R |
| Bond | 5.0 | 3.0 | 3.0 | Gentler anneal avoids tug-of-war |
| Clash | 0.0 | 0.1 | 0.1 | Fixed-scale coords make threshold meaningful |
| Dist MSE | 1.0 | 1.0 | 1.0 | — |
Training: LR 5e-5 (v11) → 2e-5 (v11b+), cosine decay, 1000 diffusion timesteps, DDIM-50 eval.
v10 — EGNN Denoiser + Full Loss Function Derivations (superseded)
8-layer SE(3)-equivariant graph neural network (EGNN), 14.6M params. Operated in R\(_g\)-normalized coordinate space. After 21 epochs: dist_mse 60% below random, bonds solved, but FAPE stuck at random baseline (~1.31) and TM-score peaked at 0.131. The model learned “proteins are compact blobs of the right size” but could not learn topology.
Loss Function Derivations
Distance MSE
Bond Geometry (annealed \(\beta(e) = \min(5.0, 1.0 + 4.0 \cdot \min(e/15, 1))\))
FAPE
Chirality (signed volumes)
Bond Angle
Radius of Gyration
Auxiliary Distance CE (disabled in v10, w=0.03 in v11+)
96 bins in v10 (2–40\(\text{\AA}\), \(\Delta\)=0.396\(\text{\AA}\)/bin). Replaced with 32-bin ordinal regression in v11+ after discovering detach-induced feature drift divergence.
Clash Loss (disabled, w=0)
Why disabled: 3.0\(\text{\AA}\) threshold in R\(_g\)-normalized coords maps to ~30\(\text{\AA}\) in real space, penalizing nearly all non-bonded pairs. Dominated ~47% of total loss in v9, drowning structural learning signal. Structural losses handle steric quality implicitly.
v10 Training Configuration
| Optimizer | AdamW (\(\beta_1=0.9, \beta_2=0.999\)) |
| Peak LR | \(10^{-4}\) with CosineAnnealingWarmRestarts (\(T_0=15\)) |
| Batch size | 8 (grad accum=2, effective=16) |
| Mixed precision | AMP with GradScaler |
| EMA | Decay=0.999 |
| Self-conditioning | 50% probability |
| Hardware | Single NVIDIA A40 (48 GB) |